July 12, 2026
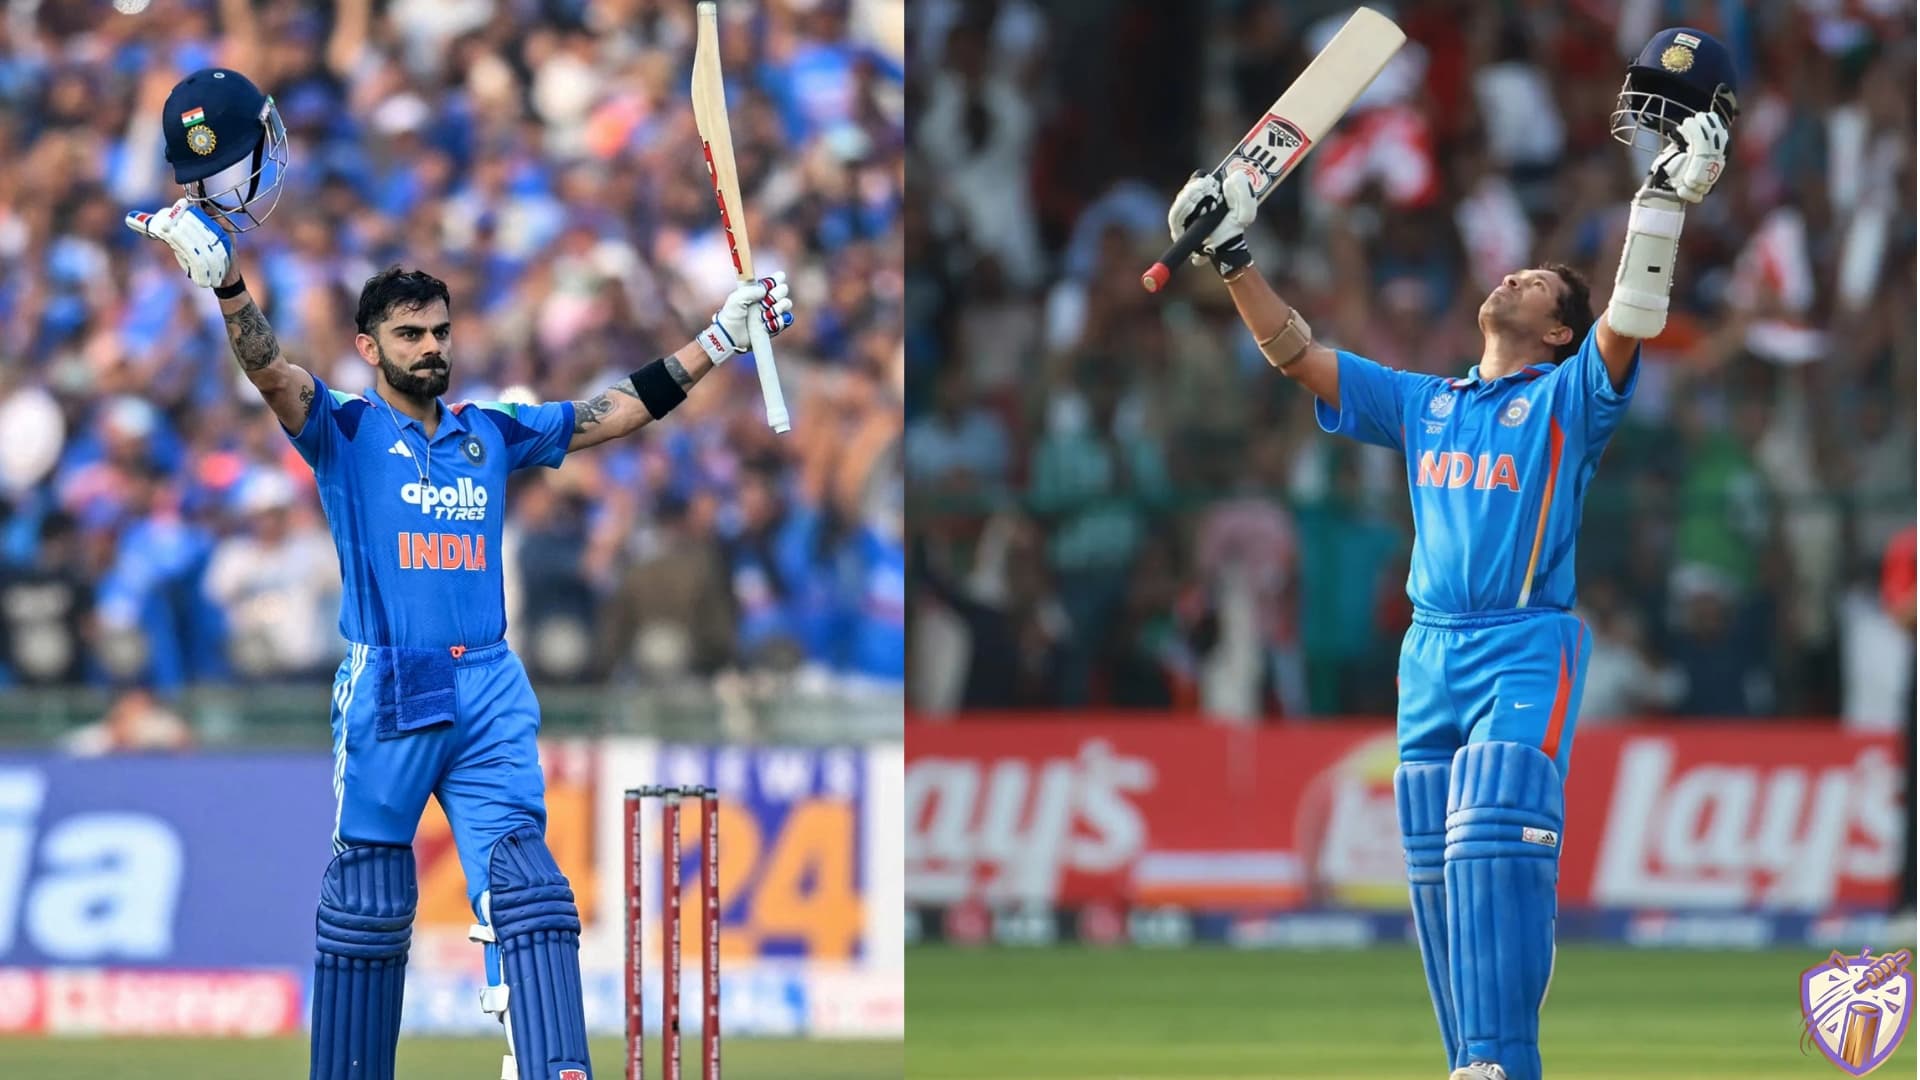
Virat Kohli and the illustrious 100 international centuries, predicted.
Virat Kohli sits on 85 international centuries. I built a prediction model using his career history and match context features estimate the probability he reaches Tendulkar's record of 100 100s.
Introduction
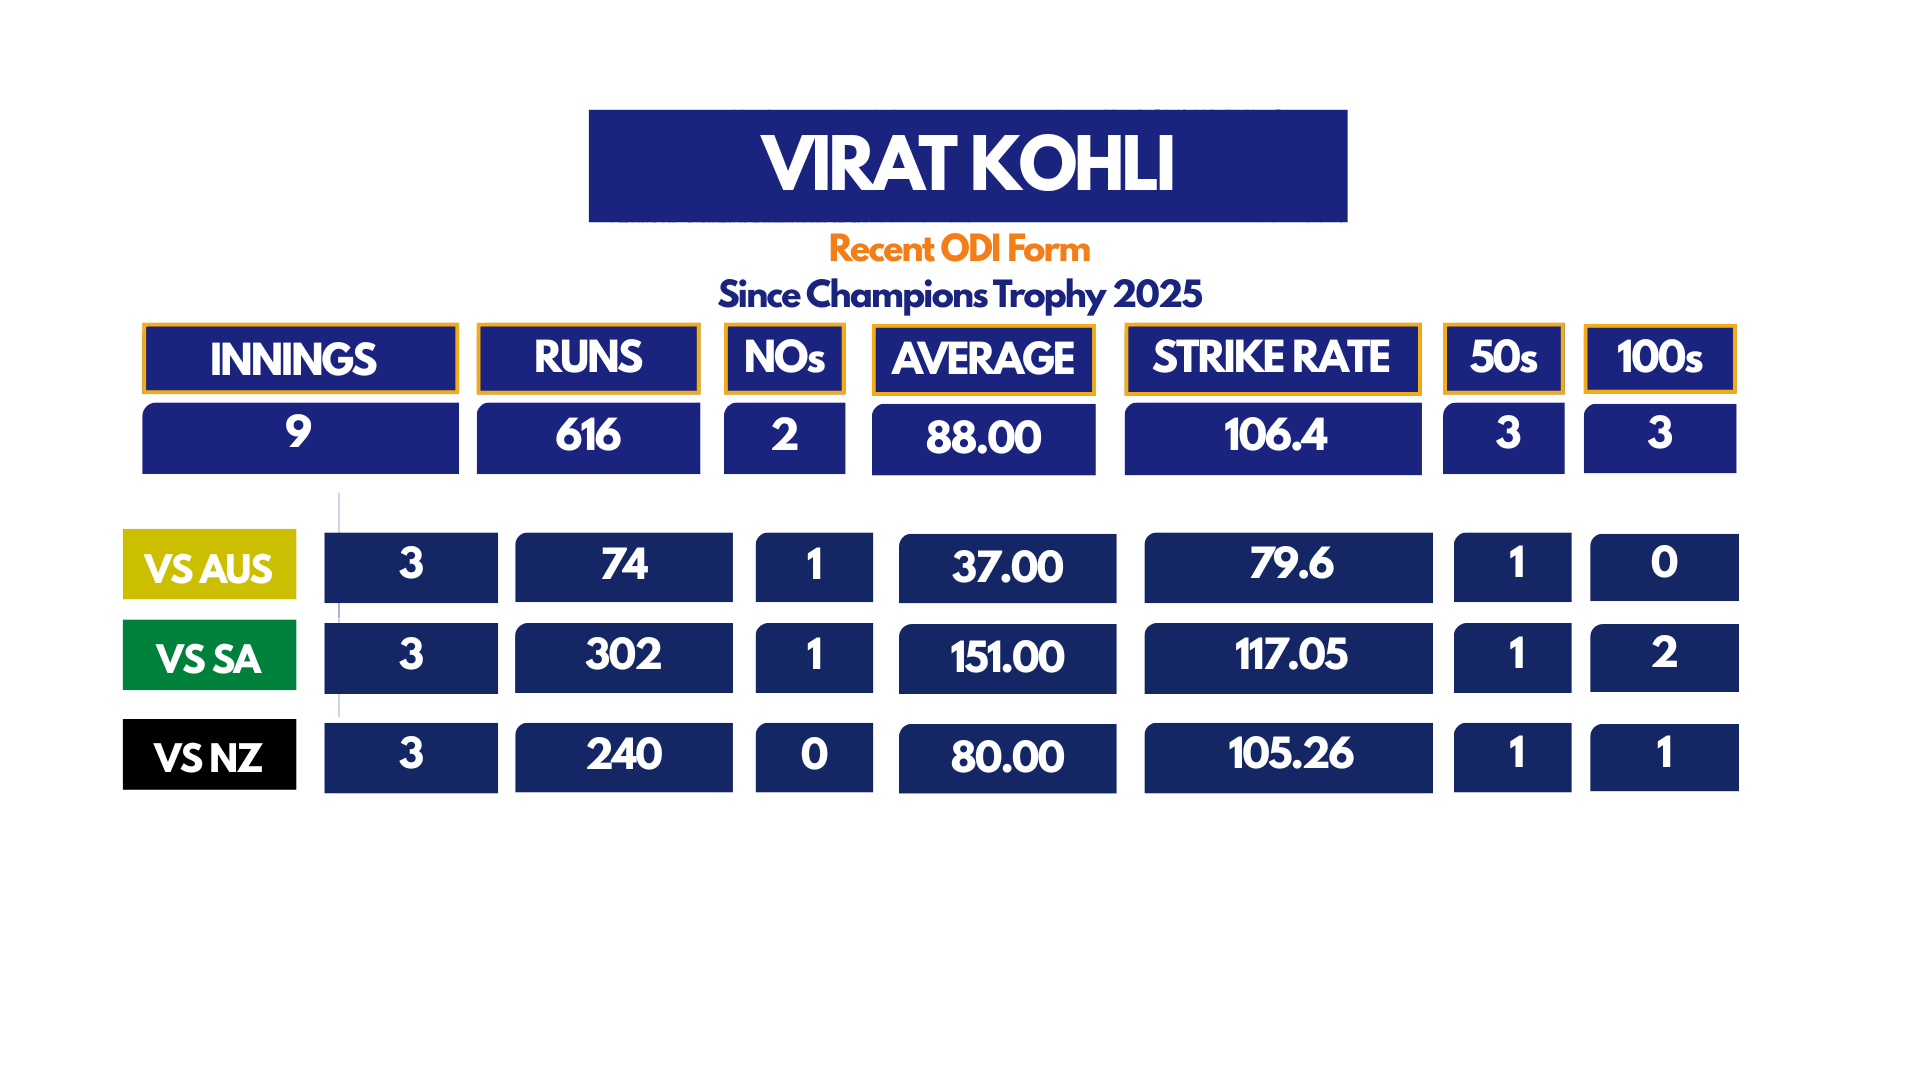
He’s 37 years old now, and plays just one of three formats, having retired from T20 internationals in 2024 and test cricket in 2025. Yet still, Virat Kohli seems hungrier than ever. In his last 9 ODIs, King Kohli has risen to new heights, averaging 88.00 and striking at 106.4 with three 50s and three 100s, since last year’s Champions Trophy. If we exclude his two ducks against Australia, his average jumps up to 123.
In what appears to be the last phase of Kohli’s stellar career, where he now sits at 85 international centuries, one question remains. Can Virat surpass Sachin Tendulkar’s record of 100 centuries in a career?
I built a machine learning simulation from scratch, pulling ball-by-ball data of Kohli’s ODI career and engineering 17 statistical features before running Monte Carlo simulations to answer this exact question, and the answer might surprise you.
Briefly, I built three probability models that predict the conditional probability of Kohli scoring a century in each upcoming ODI fixture, given the context of each game. These per-match probabilities then feed a Monte Carlo simulation that produces distributional estimates of his career century total. Each model builds upon the previous, including additional contextual signals and refining the statistical approach.
For each of the 17 upcoming ODIs which we expect Kohli to play, the models use a 5% probability that Kohli is unavailable, to account for surprise injuries or selection issues causing Kohli to miss out on any game. Given he recently missed out on the 3 ODIs vs. Afghanistan due to a hamstring injury, this 5% band of uncertainty became all the more important to include.
The models are trained on 17 statistical features that can be categorized into three buckets: recent form features, opposition & venue features, and match context features. The key difference between the models lies in the weights and bias towards different features. (Scroll down to the model architecture section for more details on feature engineering and model specifications, I left the technicalities for the end).
Here's what the models had to say.
Series-by-Series Analysis
In the next 7 months, the BCCI has confirmed 17 ODI fixtures, with 3 away in England, 3 at home vs the West Indies, 5 away in New Zealand, and 3 each against Sri Lanka and Zimbabwe at home respectively.
Each of the five series below represents a distinct opportunity profile for Kohli. I assessed each fixture, his historical record against the opponent with matchup data, the conditions, and a projected century range. The series are ordered chronologically within India's 2026–27 schedule.
Every series analysis concludes with the model’s predictions. I have displayed each of the three models’ predictions for each venue, along with the average of the three models, and Monte Carlo distributions on how likely the models predict Kohli to score a range of centuries duringthe series.
India tour of England
Format: 3 ODIs (away)
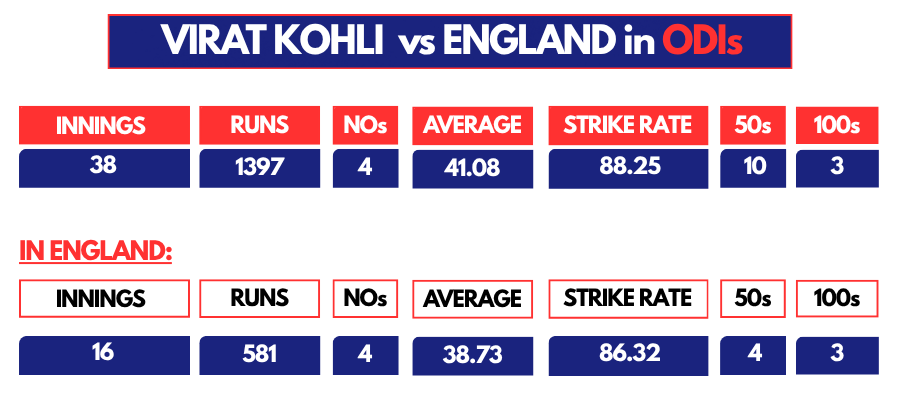
We begin with the England series, with ODIs beginning from July 14. In 38 innings against the English, Kohli averages 41.08, his second lowest against any single international team, managing 3 hundreds at a strike rate of 88.25.
His numbers drop further when playing England in their backyard, averaging just 38.73 in 16 innings at 86.32, with one century and four 50s there. His last white ball tour of England came in 2022, in the middle of what was the leanest phase of Kohli’s prolific career. Since then, however, Kohli has revamped his white ball batting, with a far more proactive and aggressive approach.
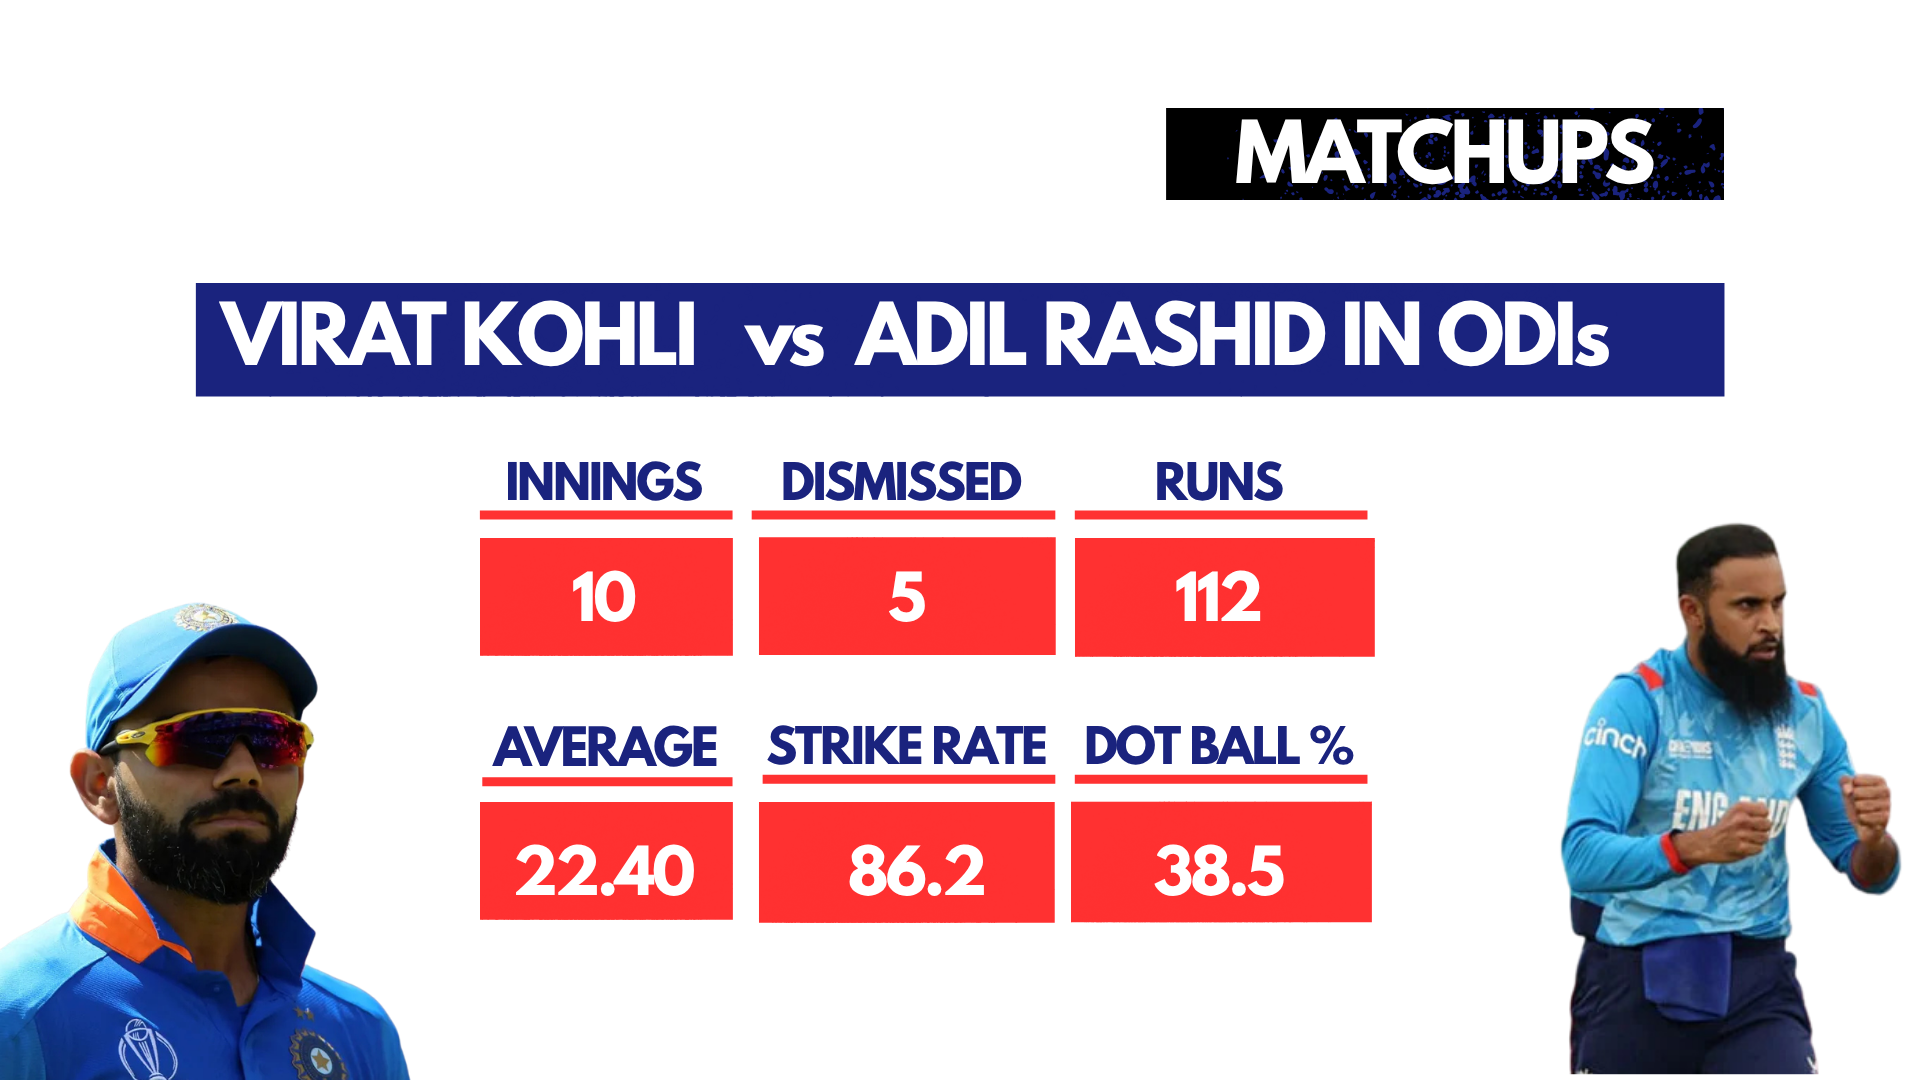
In those four years, England’s bowling attack has changed drastically. In fact, among the picked bowlers, Kohli has only faced Adil Rashid more than once in ODIs, and has personally referred to the leggie as the most challenging bowler he has faced in the format. In his 10 innings against Rashid, he has been dismissed 5 times, averaging 22, with a dot ball % of 38.5. This will be a significant question mark for Kohli to answer.
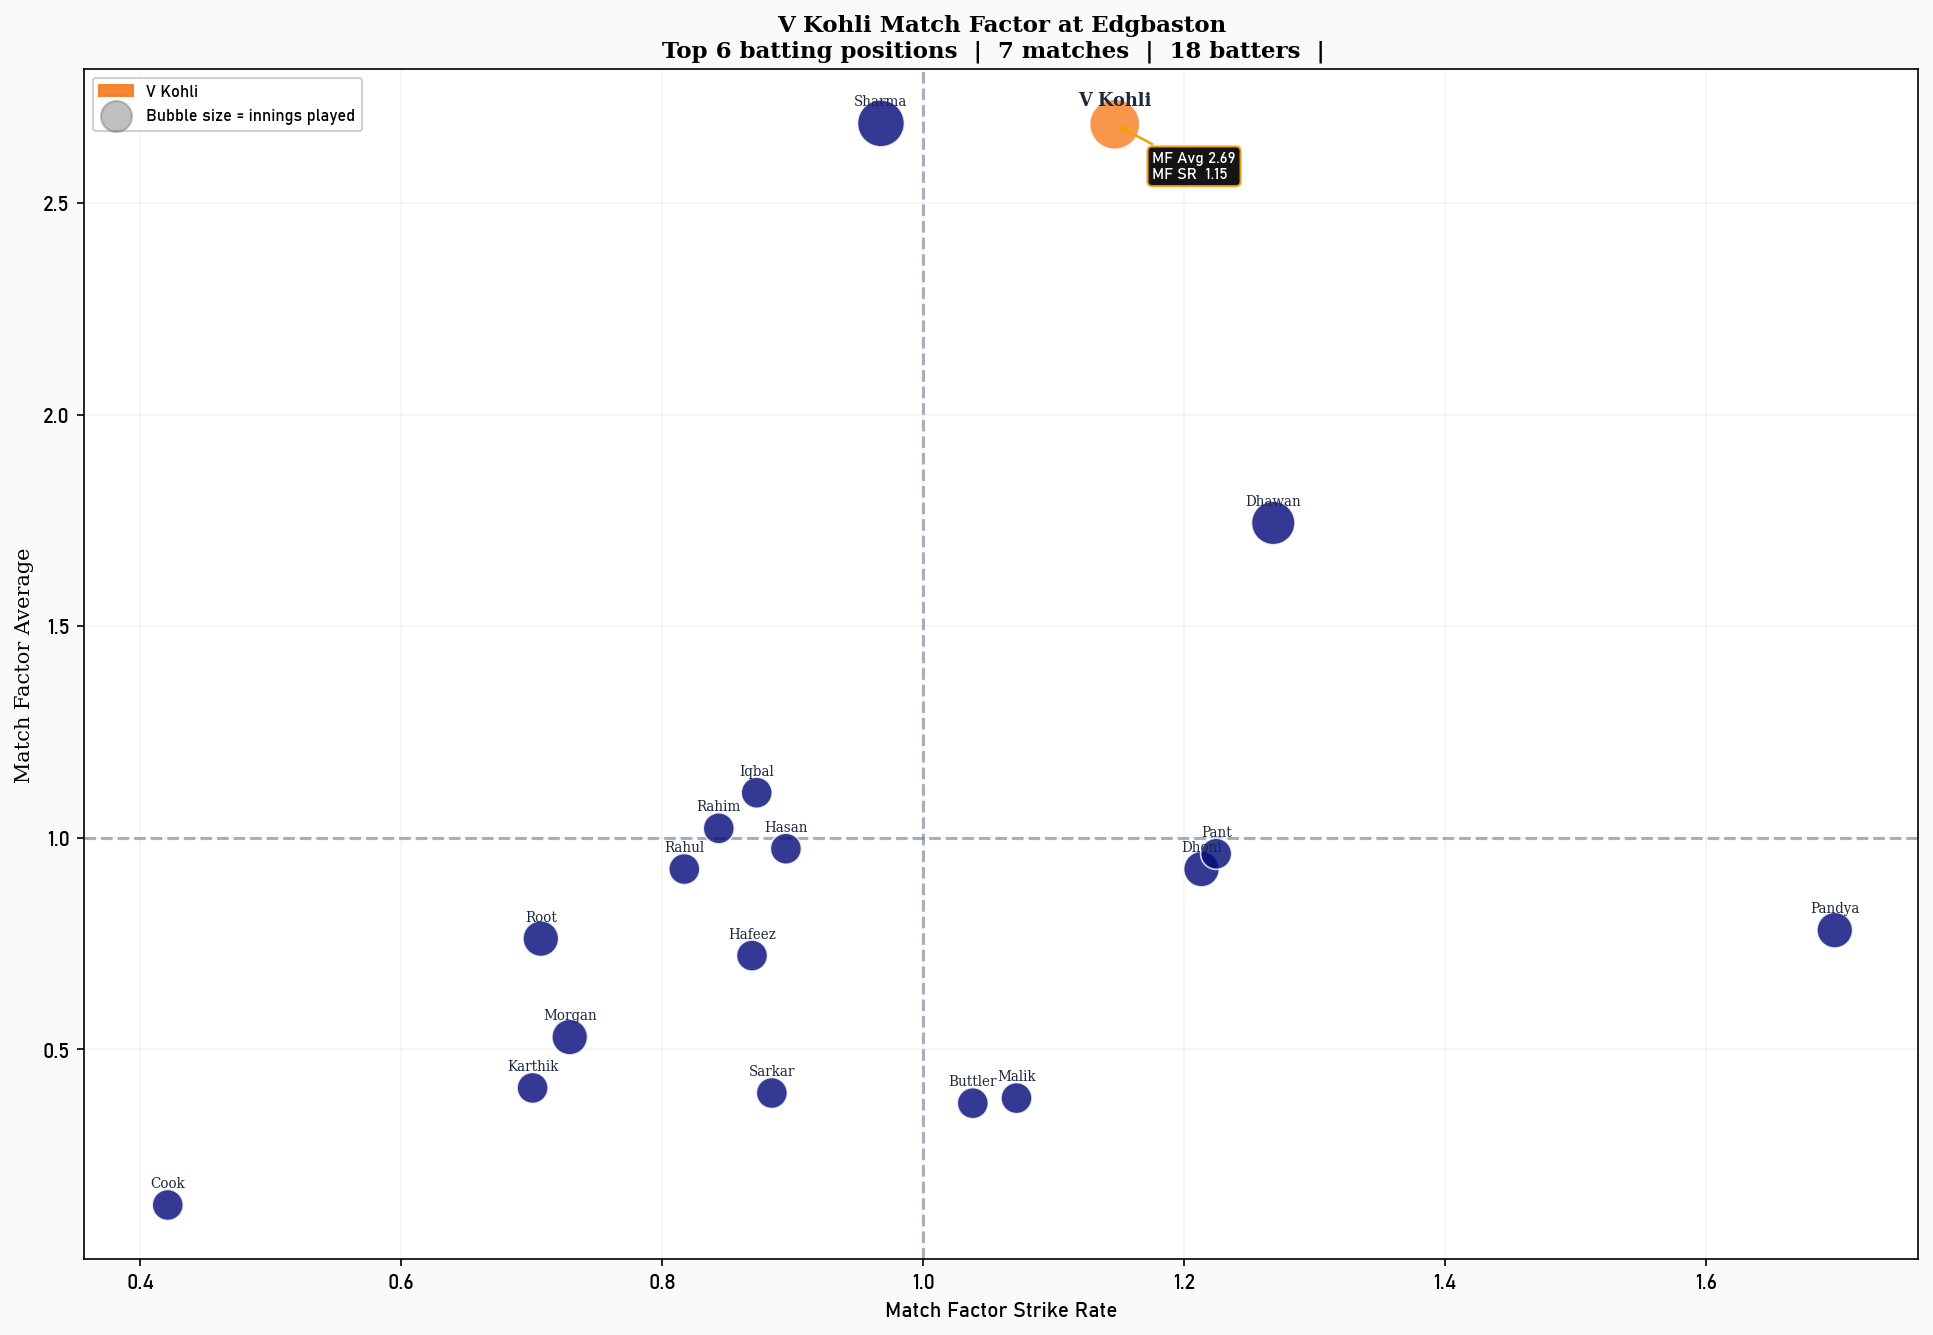
The tour begins at Edgbaston, where Kohli boasts an impeccable record, averaging 111.7 and striking at 107.0 in his 7 innings. Kohli shines here with the second-highest match factor here at 2.69, averaging a whopping 169% higher while striking at a rate 15% quicker than the average top-6 batter in his 7 games at Edgbaston. However, these games weren’t just against England, with 4 of these 7 games coming against Pakistan and Bangladesh across the 2013 and 2017 Champions Trophies, as well as the 2019 Cricket World Cup.
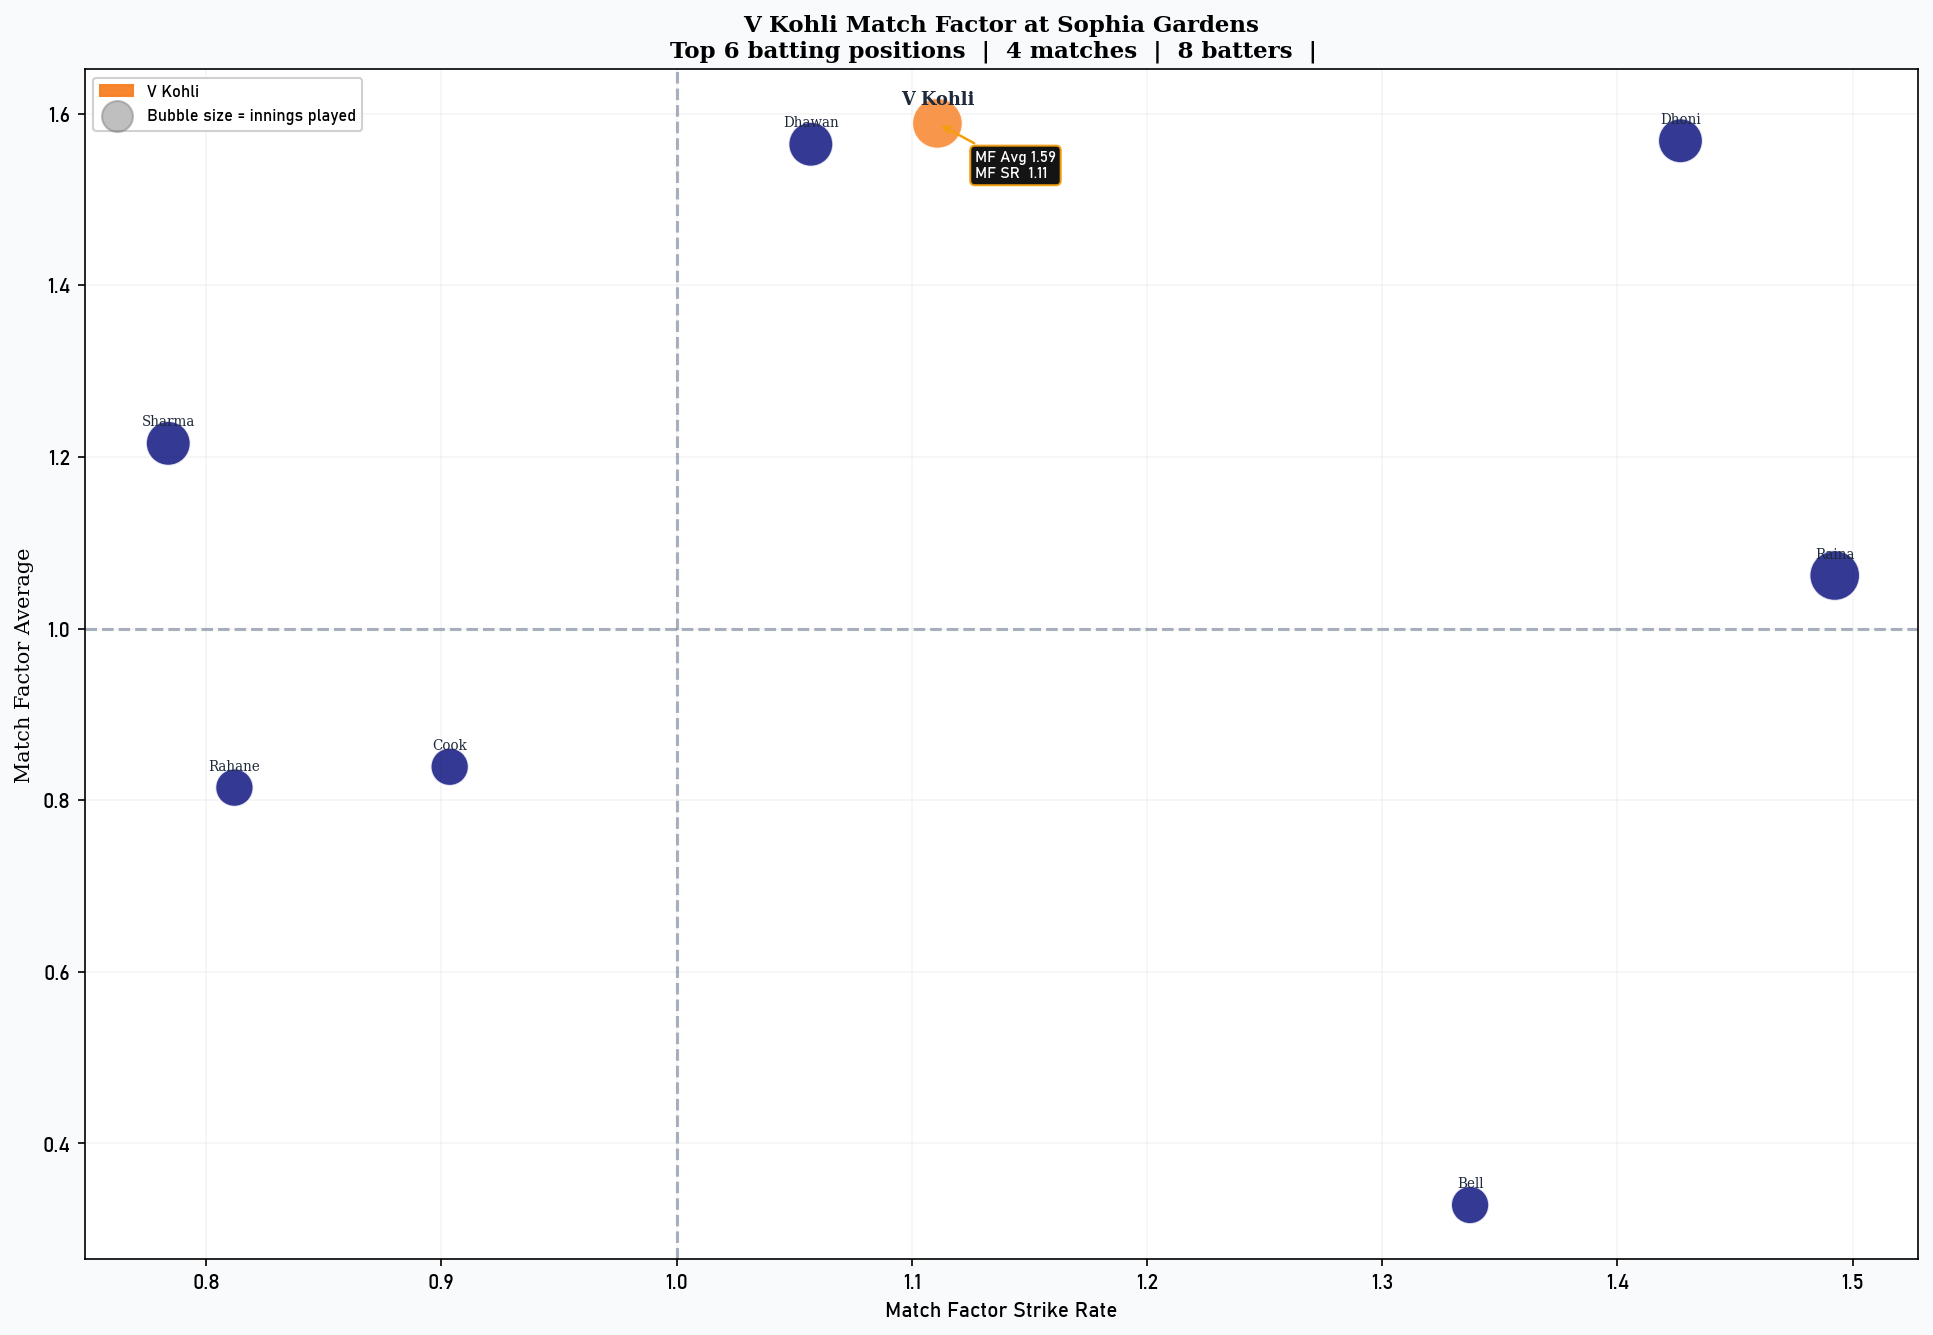
Kohli maintains a strong record at Cardiff, too, with 196 runs in 4 innings at a strike rate of 97.5, along with 1 century. He averages 59% more and strikes 11% quicker than the average top 6 batter in his 4 games at Sophia Gardens. However, Kohli last played an ODI here over a decade ago, in a 2014 white ball tour to England.
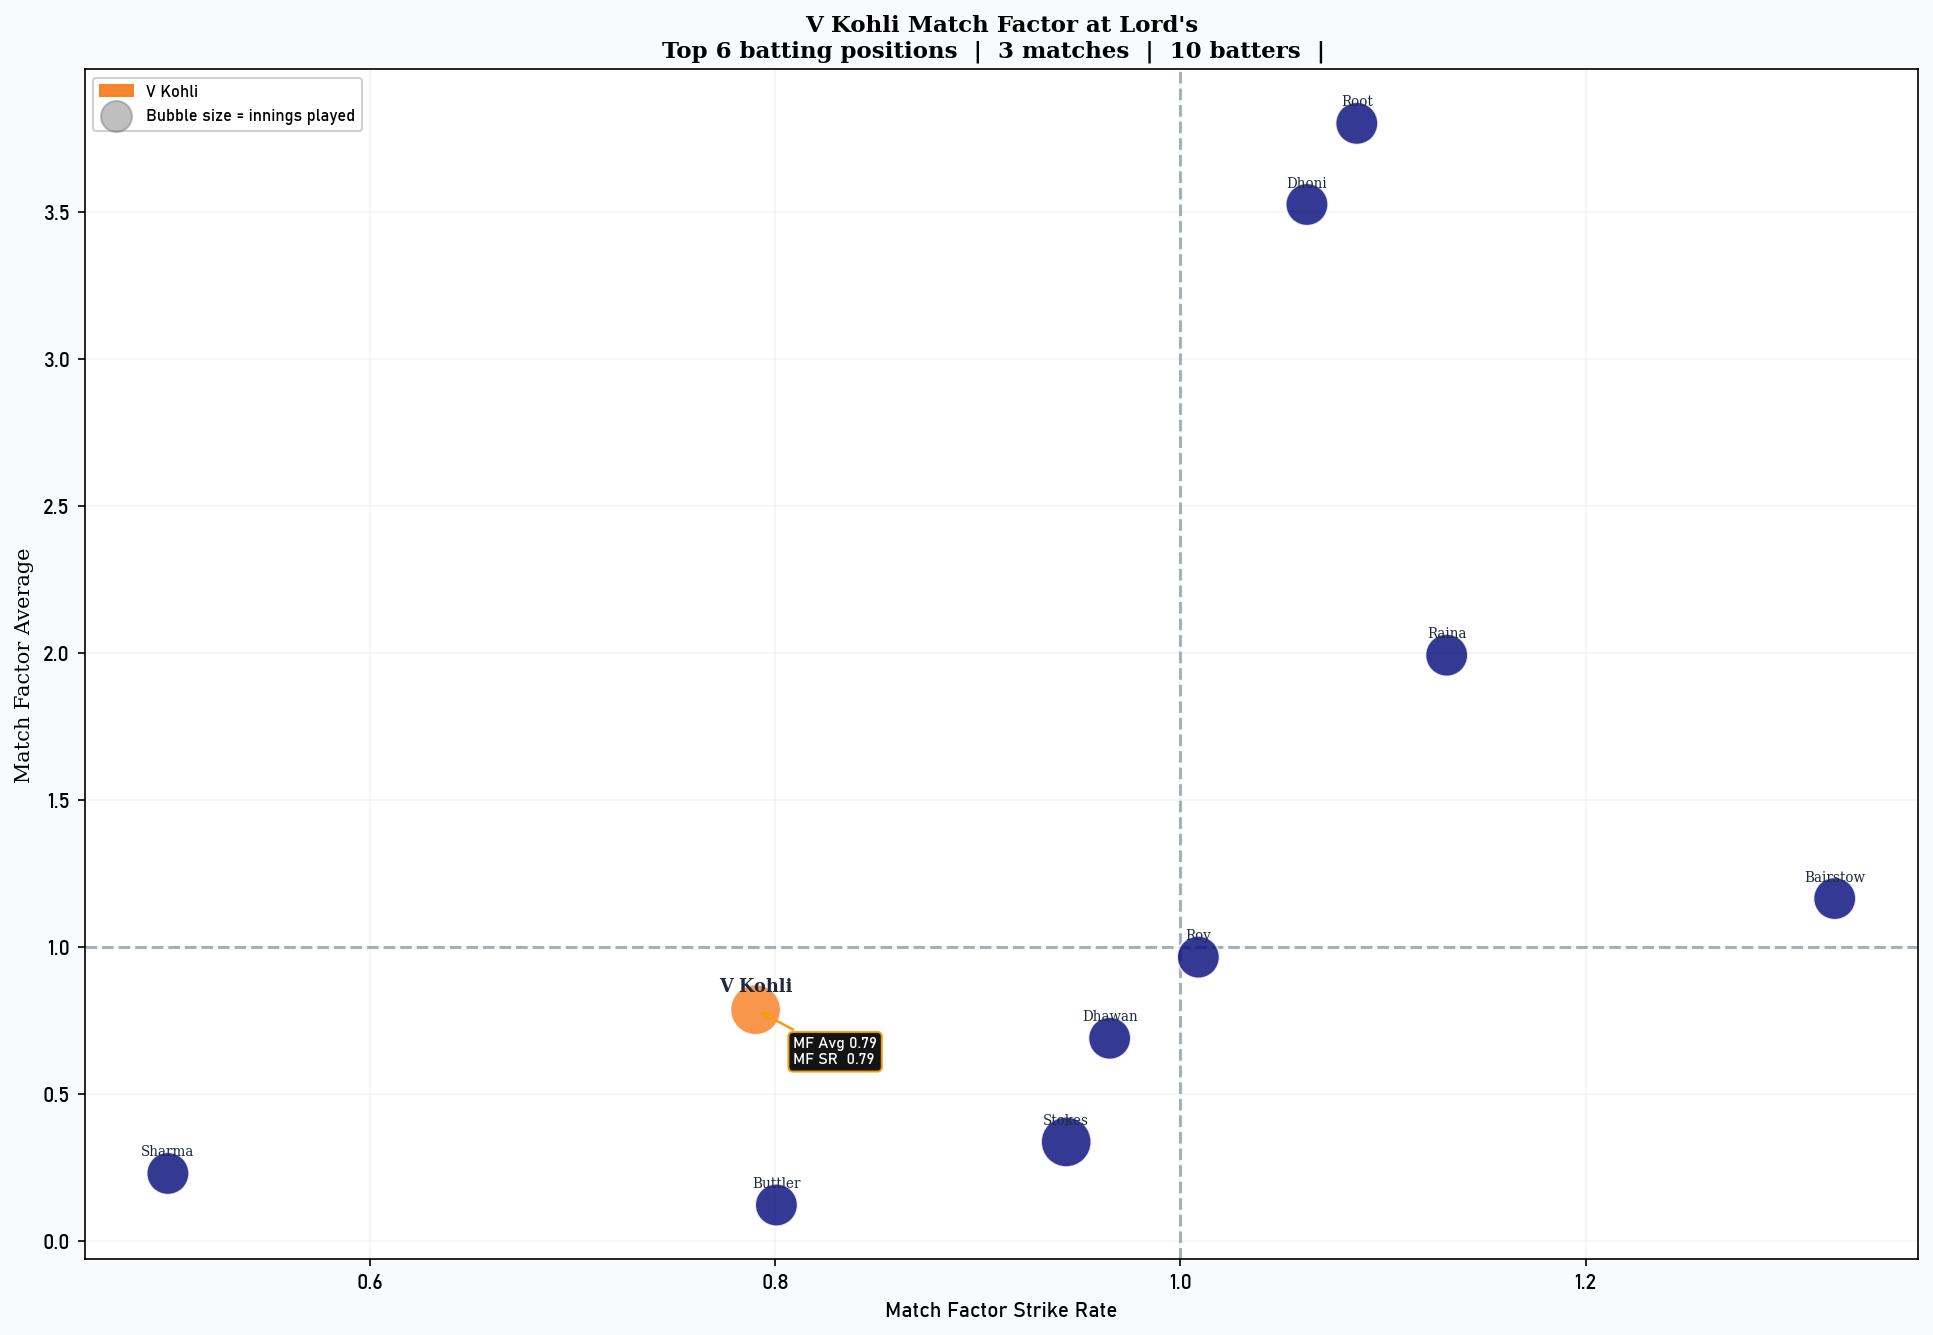
The ODIs finish at Lord’s where Kohli has the most concerning record. In his 3 innings at the home of cricket, he managed just 77 runs at 65.8, with a match factor average of 0.79 and match factor strike rate of 0.79. Of course, the last of these games came 4 years ago in 2022, and Lord’s will be an intriguing challenge for the Kohli of 2026.
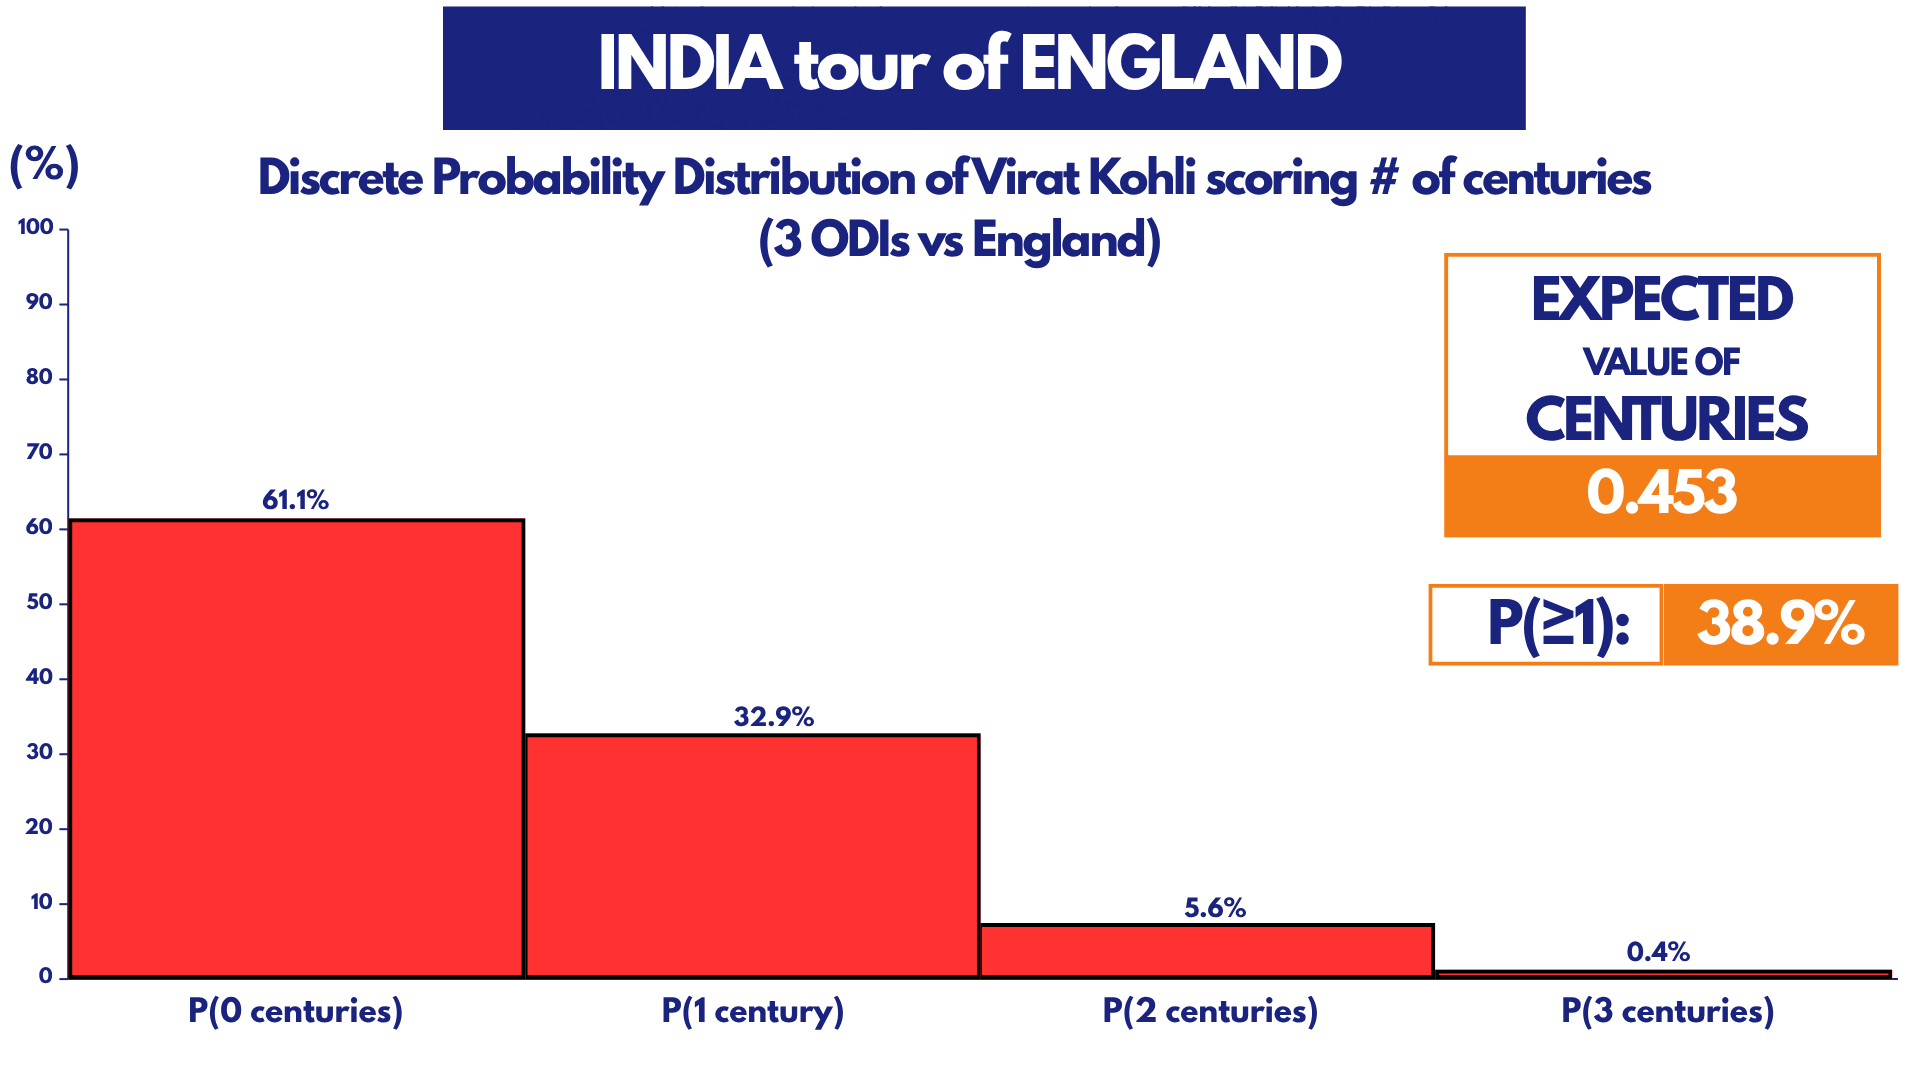
Here is a discrete probability distribution of Kohli’s chances of scoring centuries in his ODI tour of England, based on a Monte Carlo simulation of the models’ predictions. THe expected value of his centuries is 0.453, due to the fact that he is predicted to have an overwhelming 61% chance of scoring no centuries on this tour.
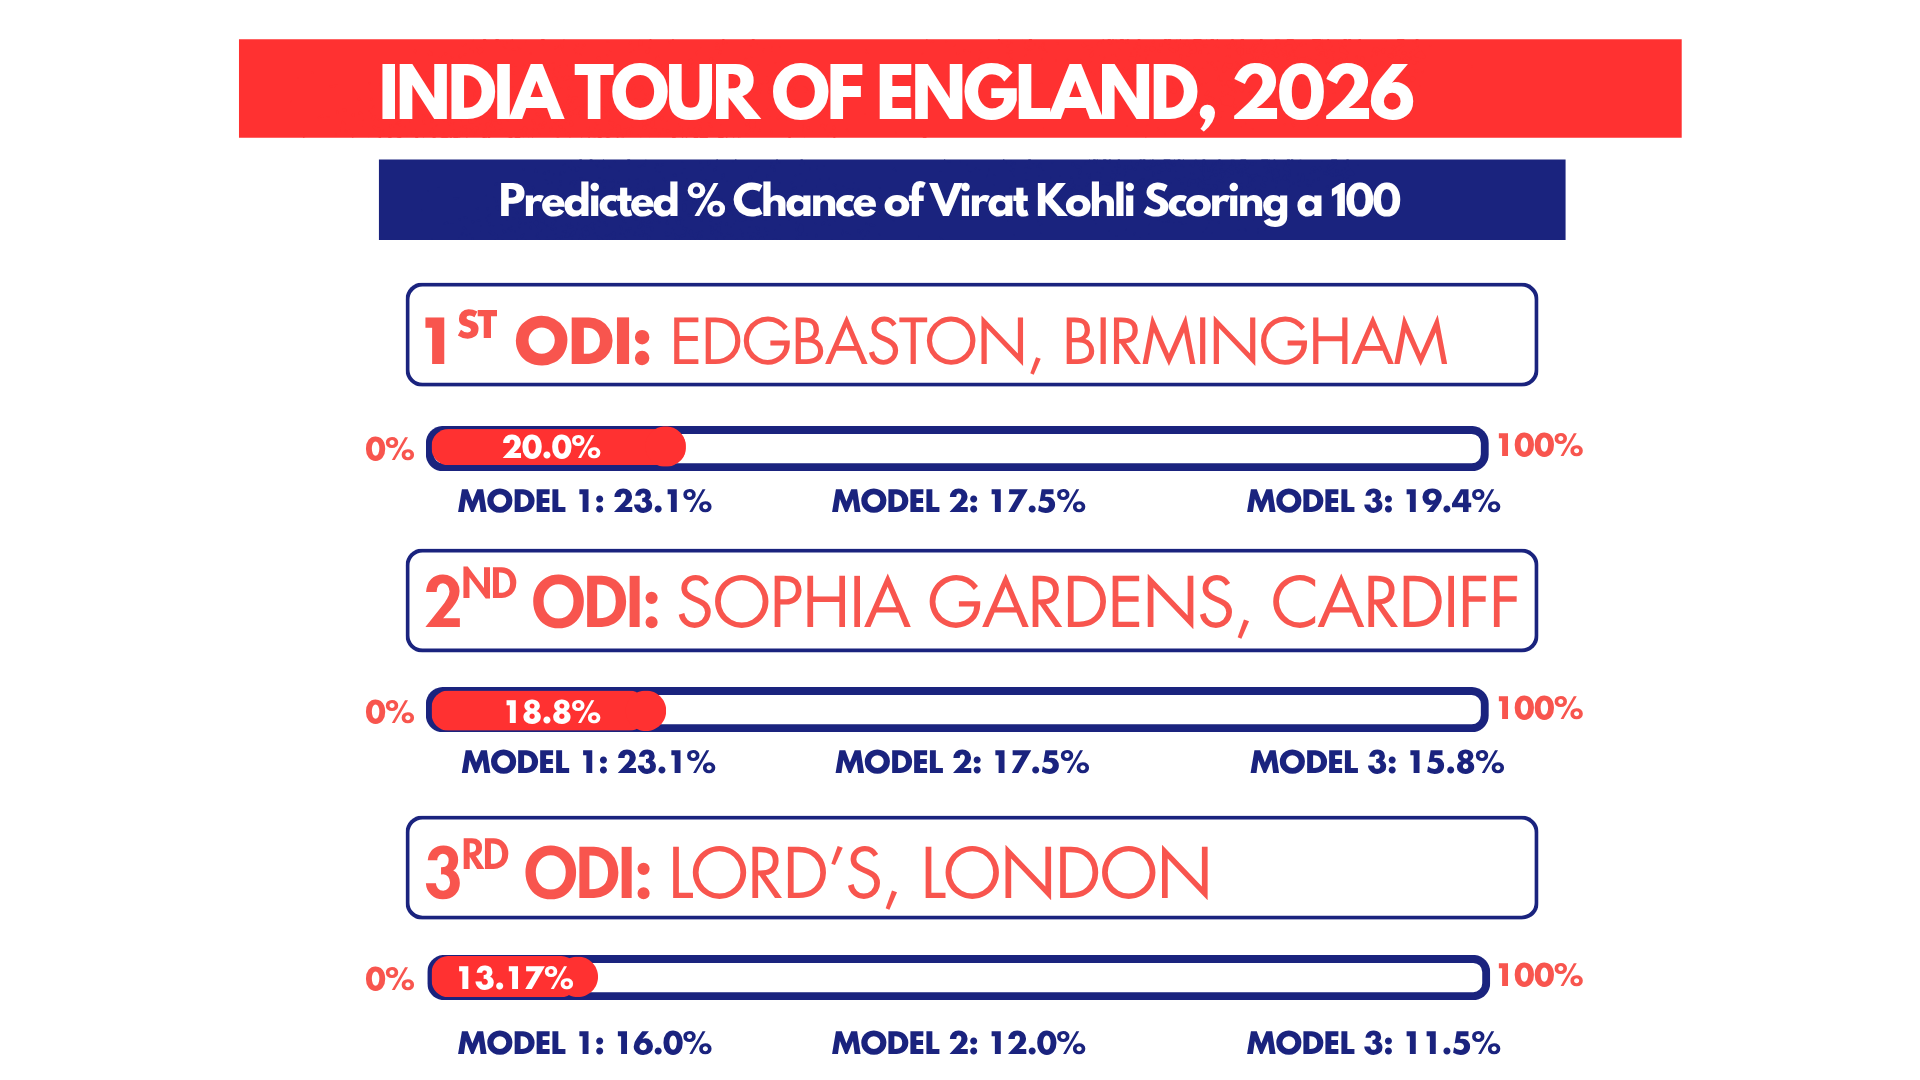
Looking at game-by-game probabilities, Kohli has the best predicted chance of scoring a century in the first ODI, at Edgbaston, with an average probability of 20% across the three models. His history here is strong, but given the 6-month break since his last ODI, and nearly 2 months since any professional game, as well as over 7 years since his last game at this venue, his chances are slightly nullified.
His average predicted probability of scoring a century at Cardiff drops to 18.8%, as although his record here is also strong, his last ODI here came over a decade ago, in 2014.
The 3rd ODI at Lord’s is where Kohli’s average predicted probability is the lowest, at 13.17%. This comes as no surprise, given his modest ODI record at the home of cricket, coupled with the 4 years since he last took to the field here.
West Indies Tour of India
Format: 3 ODIs (home)
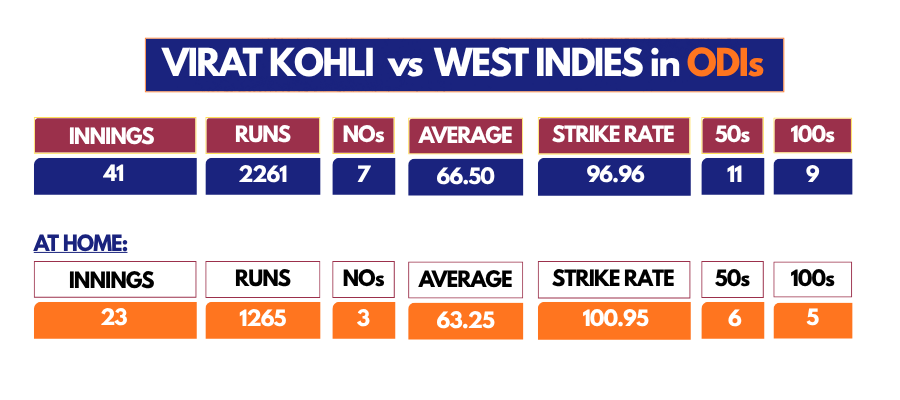
After the England series, the next ODI fixtures for India aren’t until the Windies white ball tour in September. On paper, this tour is one for Kohli to savour. Virat averages 66.50 in his 41 innings against the West Indies, striking at 97.5 with a staggering 9 centuries to go along with it. Of these 41 innings, 23 were played in India, in which Kohli has averages 63.25, with 5 centuries.
An interesting matchup awaits us between Virat Kohli and Alzarri Joseph. Kohli has been dismissed by the quick 3 times in 8 innings, averaging 26.0, with a dot ball percentage of 42.5%. However, he strikes at 114.7, and with the ruthless approach he has taken against quicks in recent years, across ODIs and T20s, it will be interesting to see how this battle plays out.
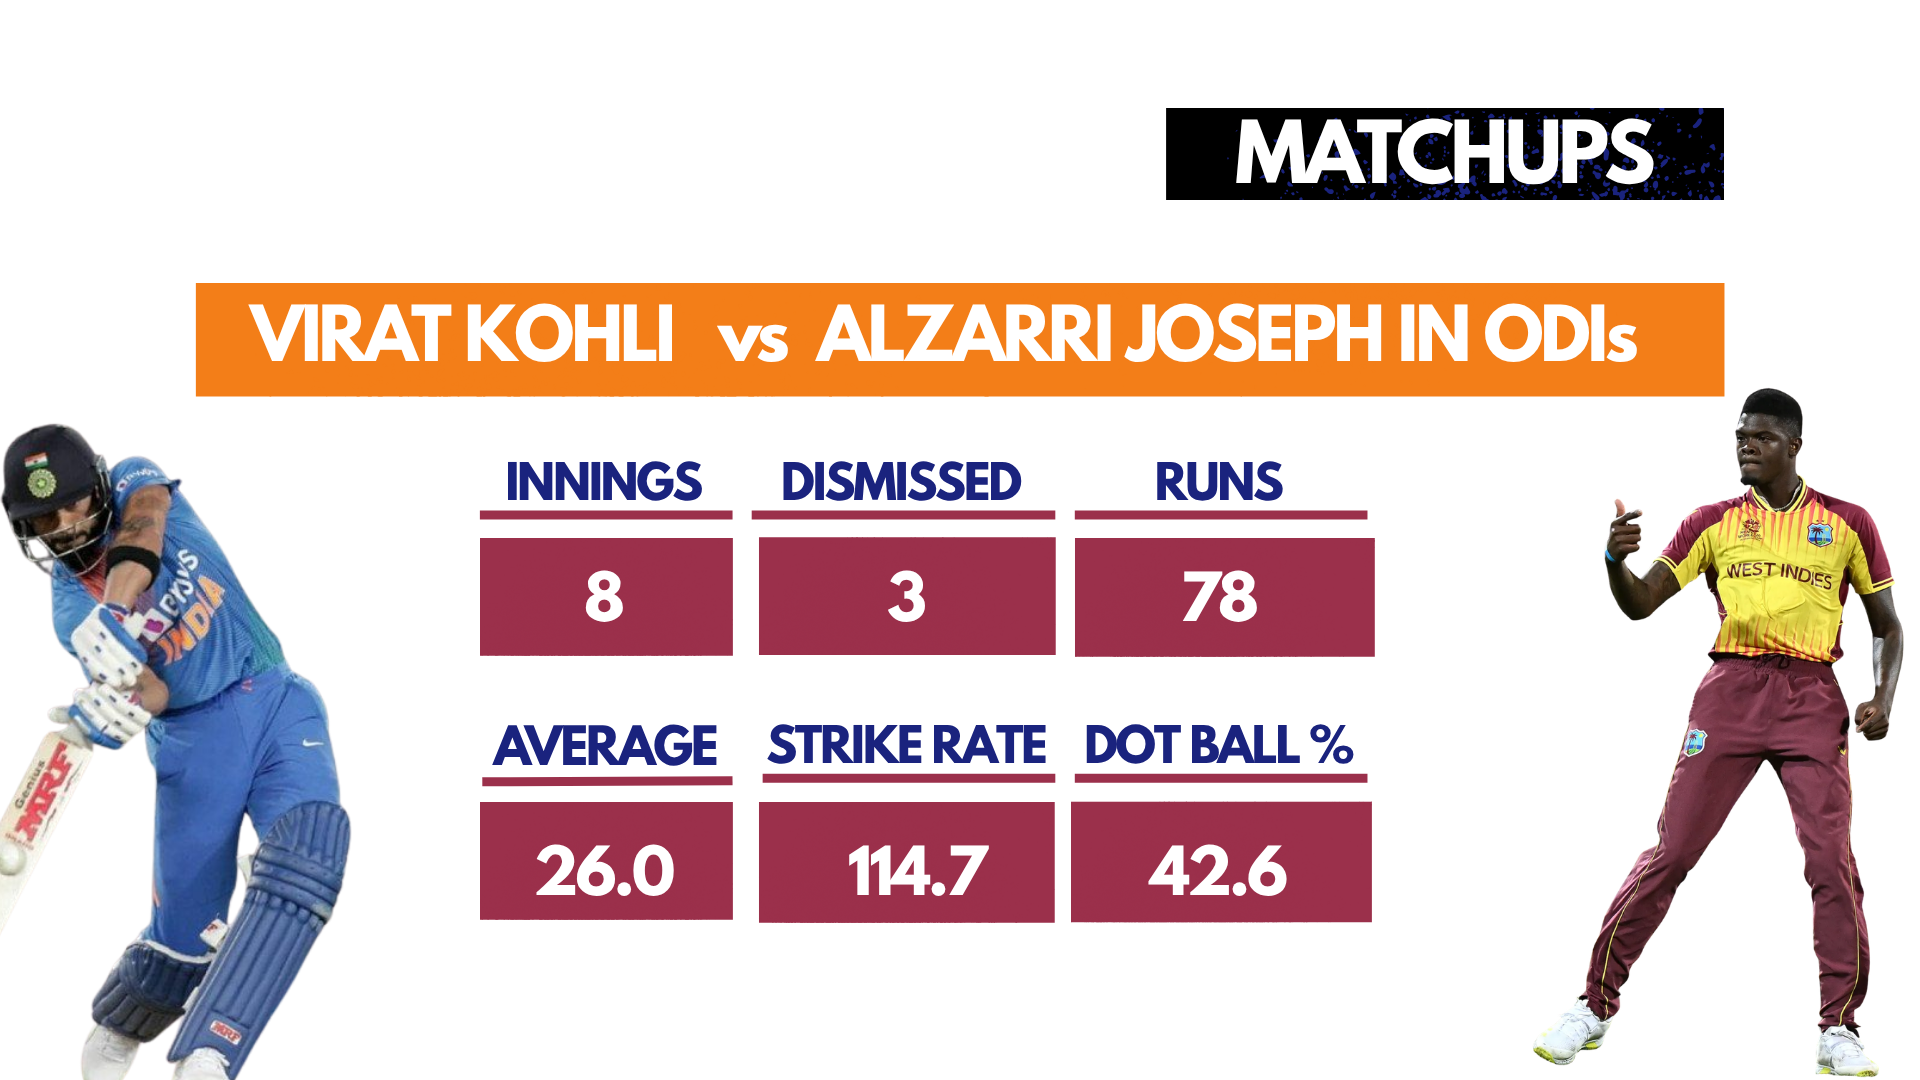
Among all the bowlers named in the Windies squad for the 3 ODIs vs Sri Lanka last month, Alzarri Joseph is the only bowler Kohli has faced in ODIs. This lines up a good contest between the West Indies’ exciting frontline quicks who have made waves in international cricket over the last few years: Shamar Joseph and Jayden Seales.
Kohli also hasn’t had a chance to face Gudakesh Motie in ODIs, and given left arm spin has been a problem for the batter in recent years, Motie’s exploits may be volatile. The spinner hasn’t been in the greatest of form, though, picking up just 20 wickets in 23 ODIs he has played since 2024, at an average of 46.3, significantly higher than his career average of 32.3.
The first ODI is in Trivandrum, a ground where Kohli is yet to be dismissed in the 50-over format. From two innings, he managed an unbeaten 33 and a mammoth unbeaten 166 against Sri Lanka in 2023, and will certainly be looking to continue his hot streak at Trivandrum.
The next ODI moves to Guwahati, where Kohli’s record reaches new heights once again. He’s played 3 games here, of which 2 came at the new Barsapara Cricket Stadium, and recorded a century in each of his 3 innings (against New Zealand, West Indies, and Sri Lanka respectively). Much like Trivandrum, within a small sample size of innings here, Kohli has been unstoppable, and his recent form looks to only make him more dangerous in the first two ODIs, and although the 3rd ODI will be the first ever to be hosted at Mullanpur, where Kohli hasn’t played an innings barring a few IPL games, the stage is set for Kohli to dominate against the West Indies at home this September.
The models weighted match factor less for this series, given his small sample size at these venues. Below is the discrete probability distribution of Kohli's chances of scoring centuries in this 3-match ODI series at home. Across the three models, the simulation gives Kohli a 70.0% chance of scoring at least one century in this series, with an expected value of 0.977.
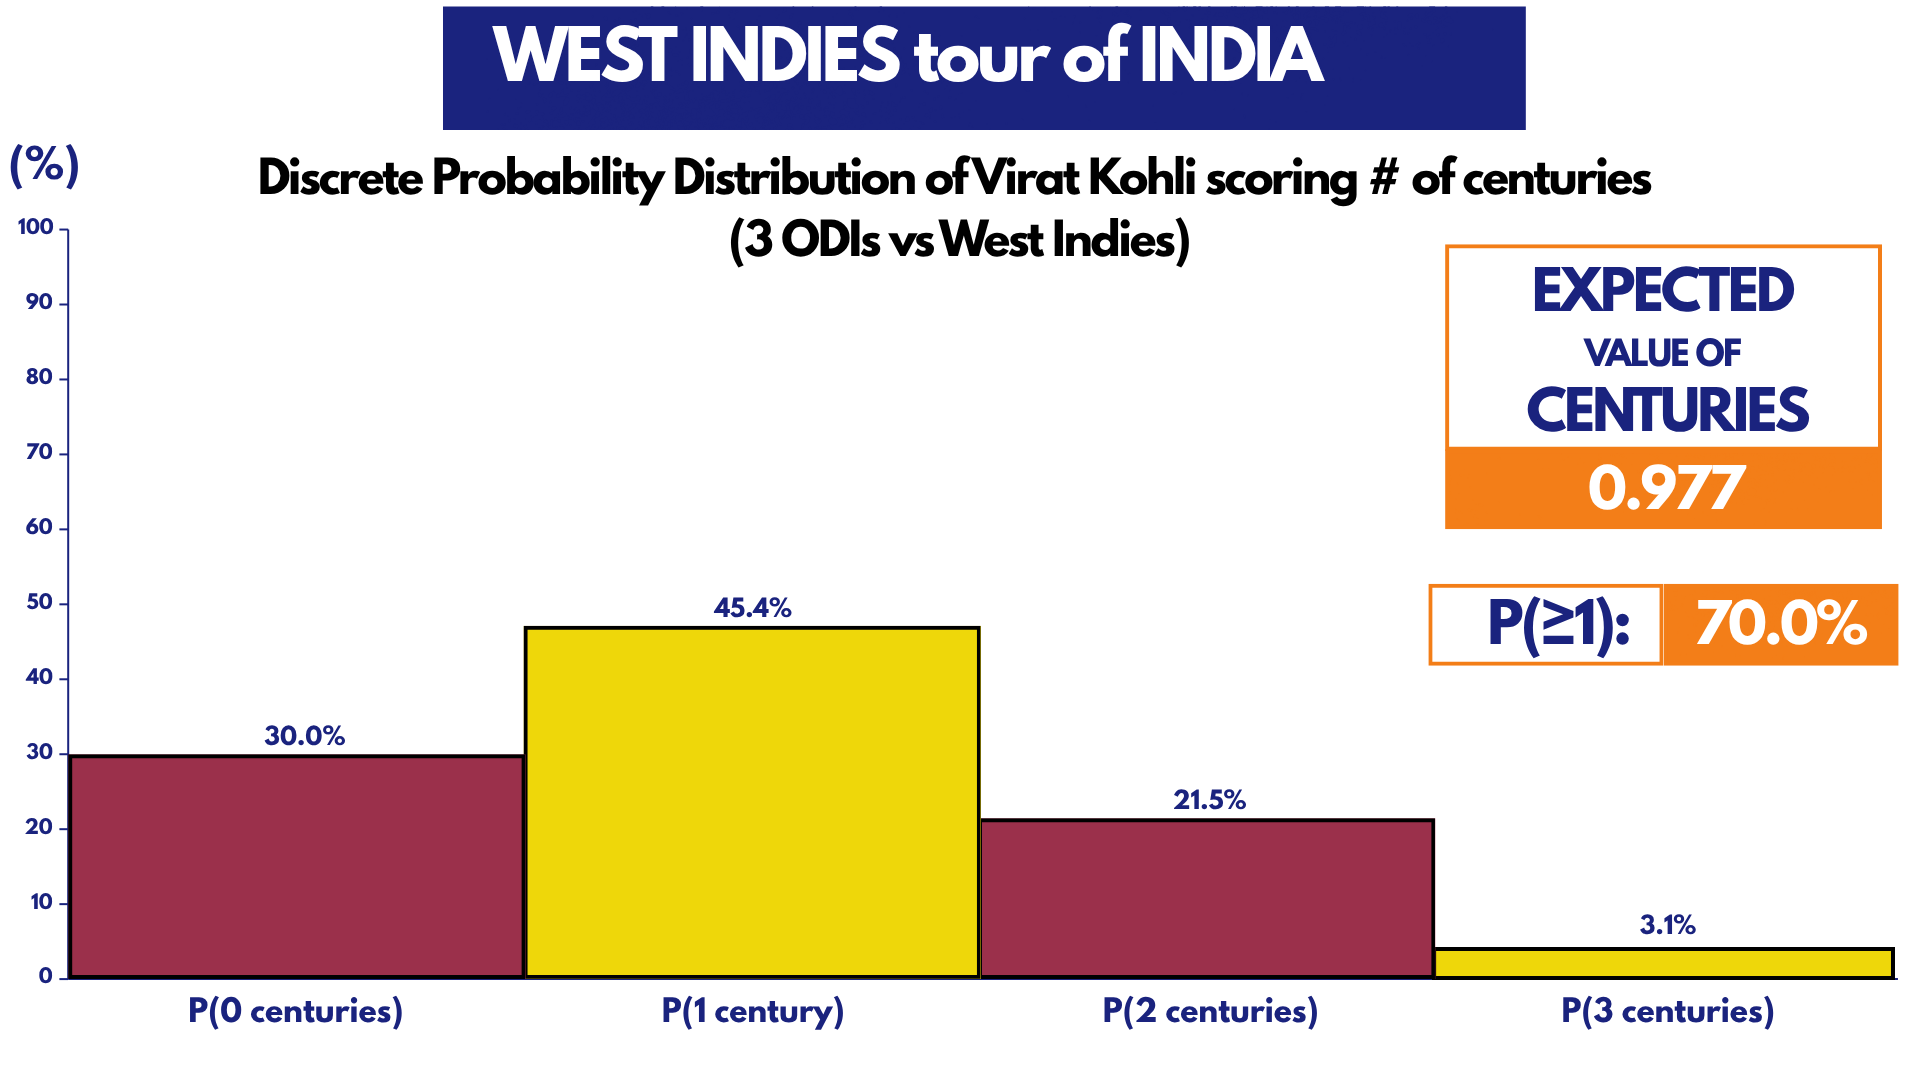
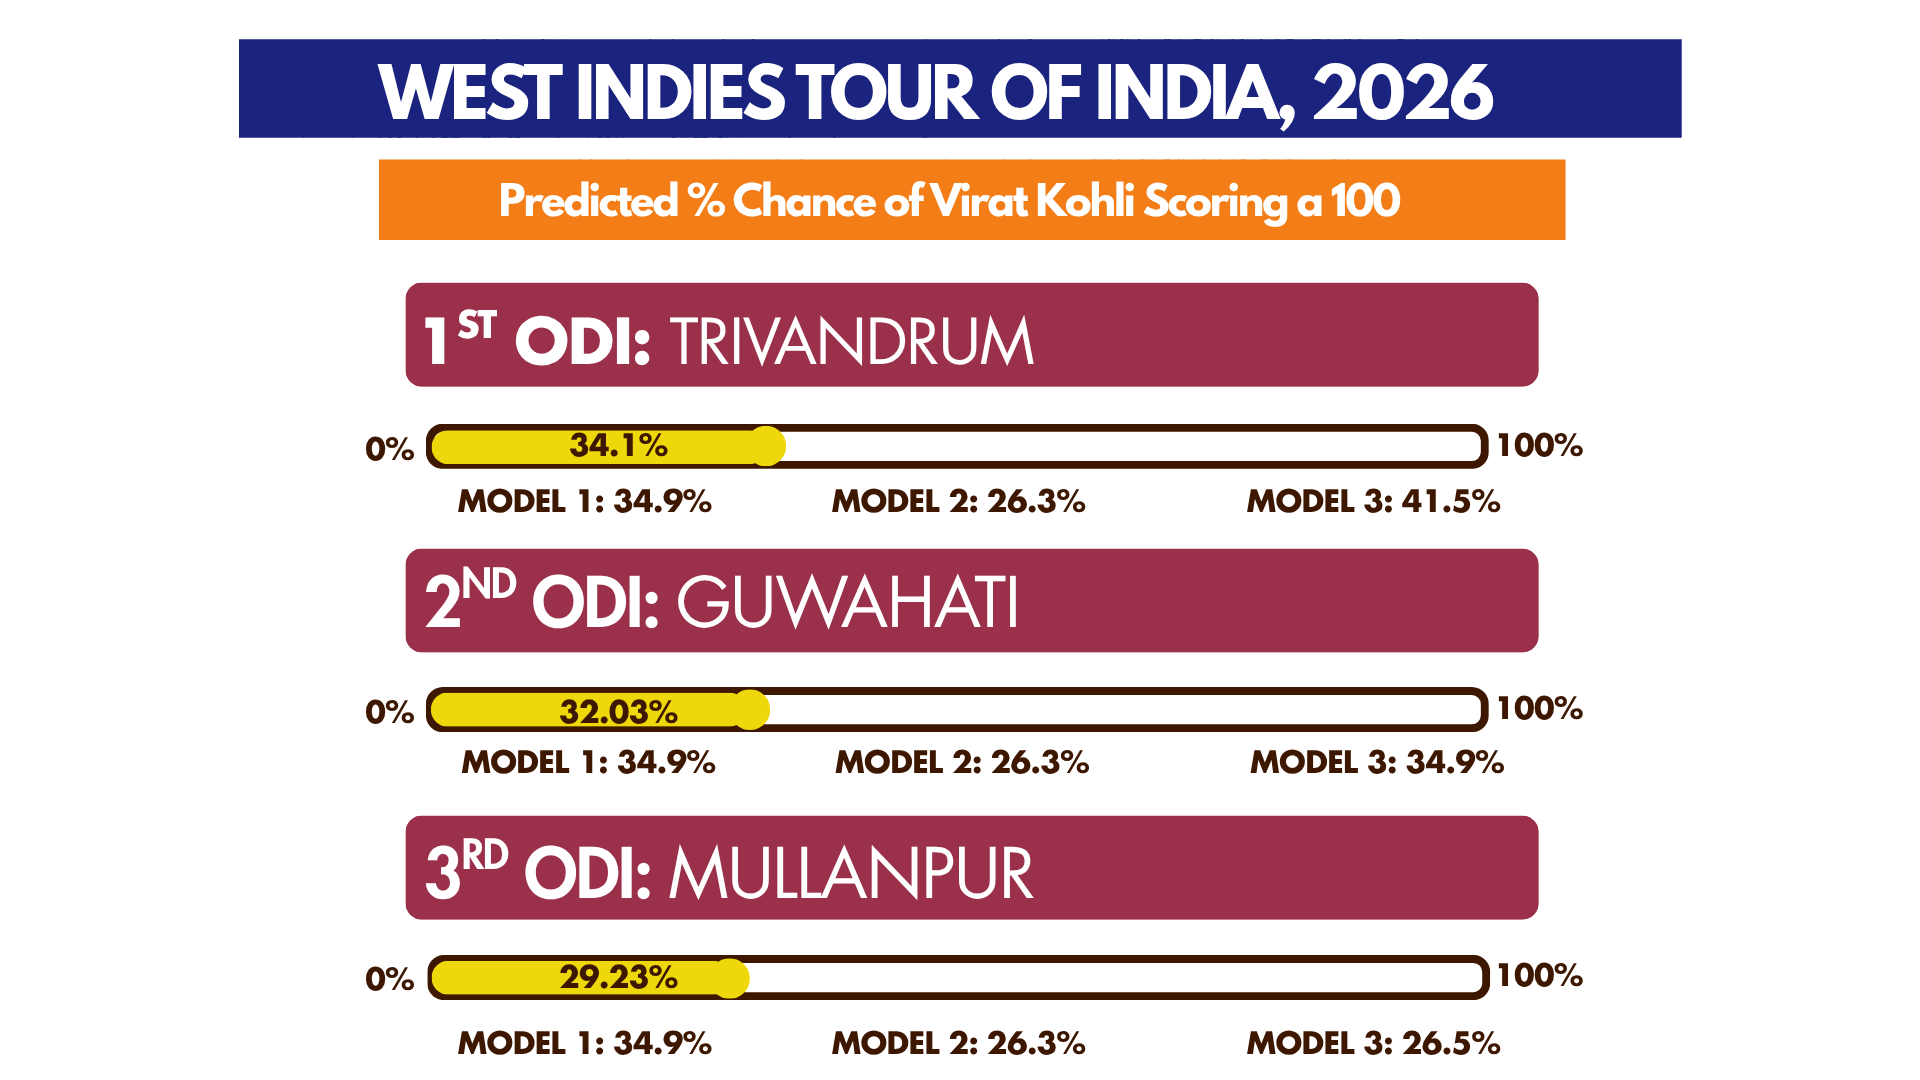
On per-game predictions, Kohli has the best predicted chance at Greenfield International Stadium in the first ODI, with an average probability of 34.1%. That probability drops with each game, to 32.03% in Guwahati, and 29.23% in Mullanpur, where he is yet to play an ODI.
India tour of New Zealand
Format: 5 ODIs (away)
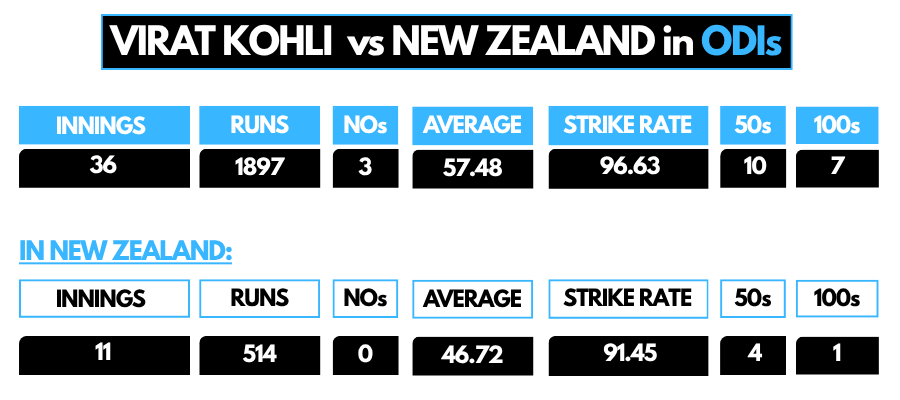
We then move to India’s all-format tour of New Zealand, with 5 ODI fixtures. While Kohli’s overall record against the Blackcaps is strong, averaging 57.48 and striking at 96.6 in 36 games, with 7 hundreds, one coming as recent as January 2026, his numbers drop when playing away from home. New Zealand is where Kohli has his second-lowest ODI average by country, albeit an outstanding average of 49.66 in 13 games, a relatively weaker area of Kohli’s record. More importantly, he last toured New Zealand in February 2020, over 6 years ago, and will likely find the conditions far more challenging than the home series against West Indies. The open stadiums in New Zealand harbor stronger winds, and aid swing and seam movement early on.
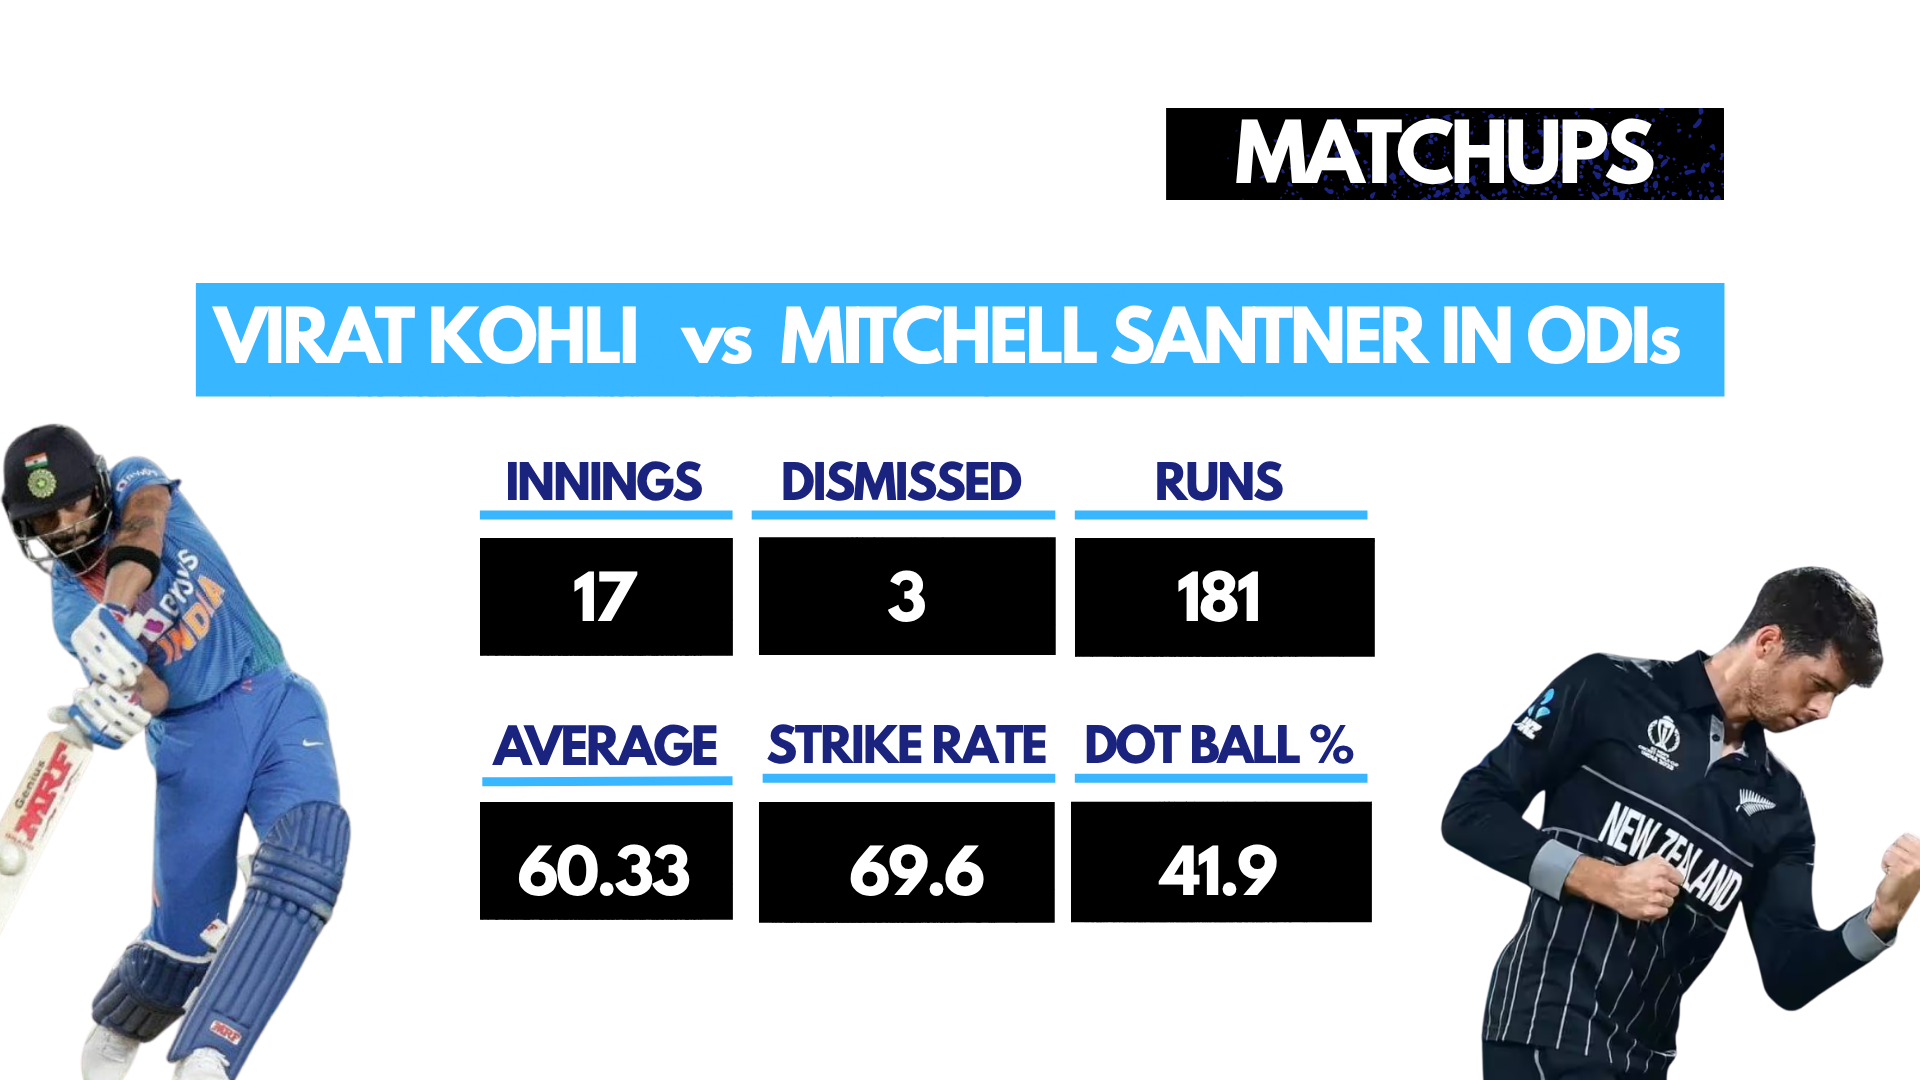
Fortunately, we got a close look at how the latest version of Kohli in ODIs stacks up against New Zealand’s new string of bowlers, many of whom will feature in the upcoming tour. Among these matchups includes Kohli’s battle against Santner. While the left-armer has only dismissed Kohli thrice in 17 encounters, Kohli strikes at just 69.6 against Santner, with a surprisingly modest boundary percentage of just 2.7%. Kohli has historically been happy to play out Santner's overs and keep rotating the strike, but his new, more positive batting approach may look to take greater risks against the spinner.
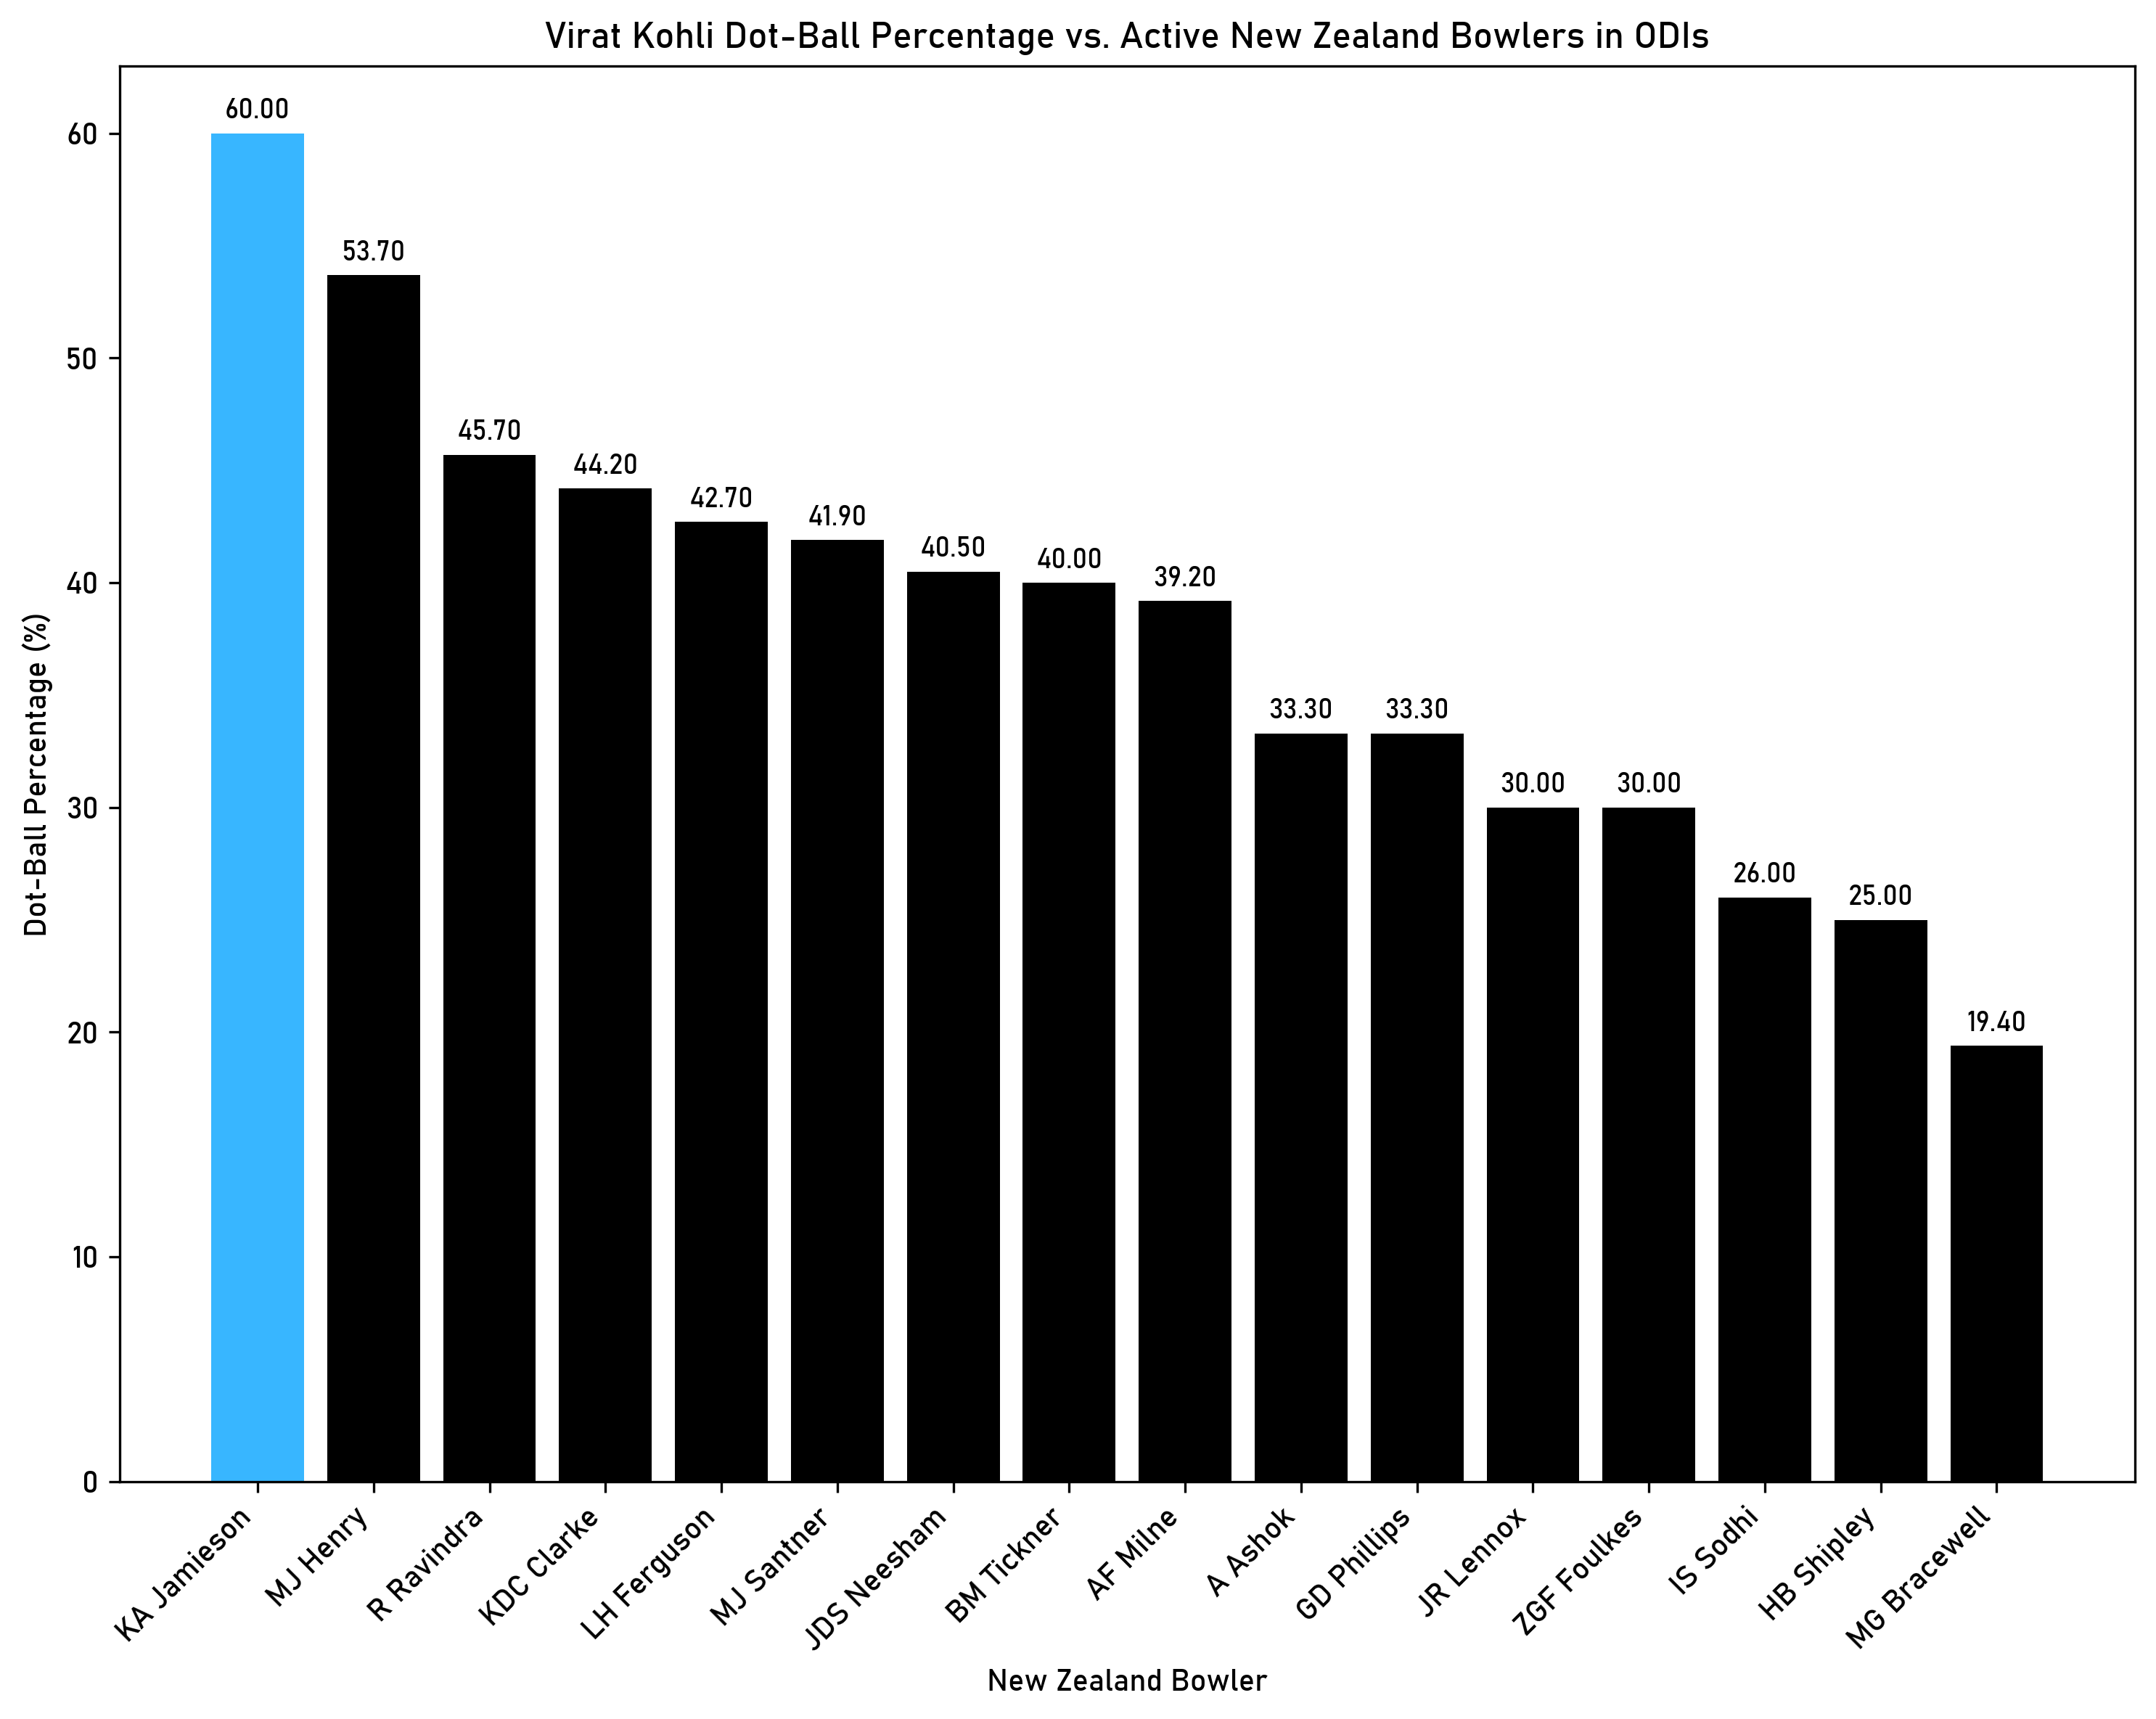
Kyle Jamieson has also been a thorn in Kohli’s flesh, albeit dismissing him just once in 6 innings. Out of all active kiwi bowlers, Kohli has the highest dot ball percentage against Jamieson, at 60%.
Kristian Clarke also troubled Kohli, dismissing him twice in 3 games in New Zealand’s visit to India earlier this year, however it seemed as though it was Kohli’s intent that got the better of him on both occasions. He played onto his stumps in the first dismissal, looking to cut the ball behind square, and was caught at long off looking to clear the boundary the second time around.
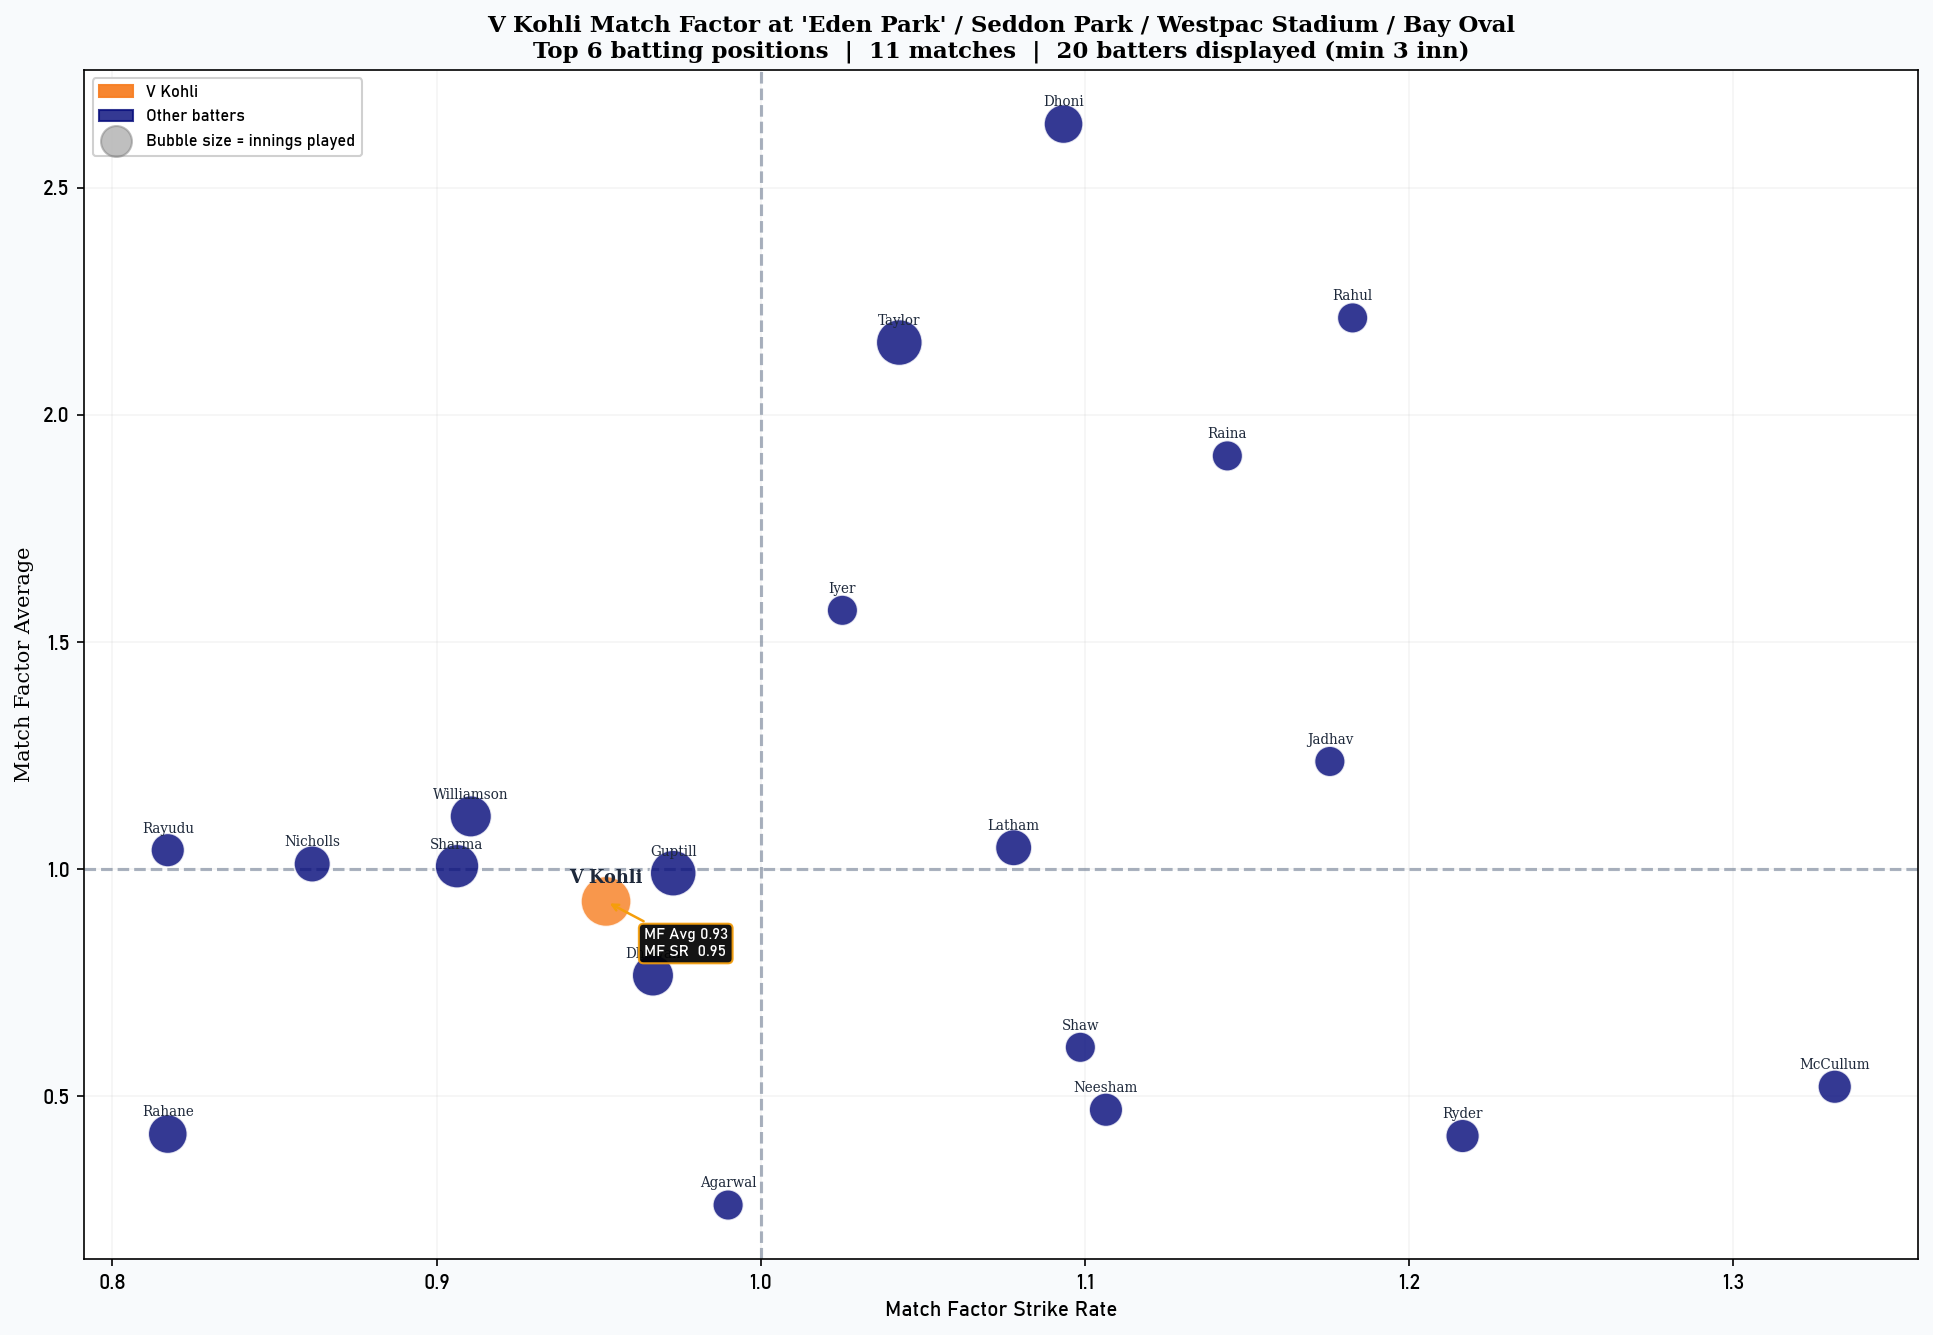
Kohli has played 11 ODI innings across the 4 different venues in New Zealand, set to host India in October. In these ODIs, he averages 9% lower and strikes 4% slower than the average top 6 batter from these games. In his last ODI tour of New Zealand, he scored 75 in 3 innings, with a high score of 51. Moreover, Kohli’s only century in the country was in Napier, which isn’t hosting any of the upcoming ODIs. That was also way back in 2014, over 12 years ago.
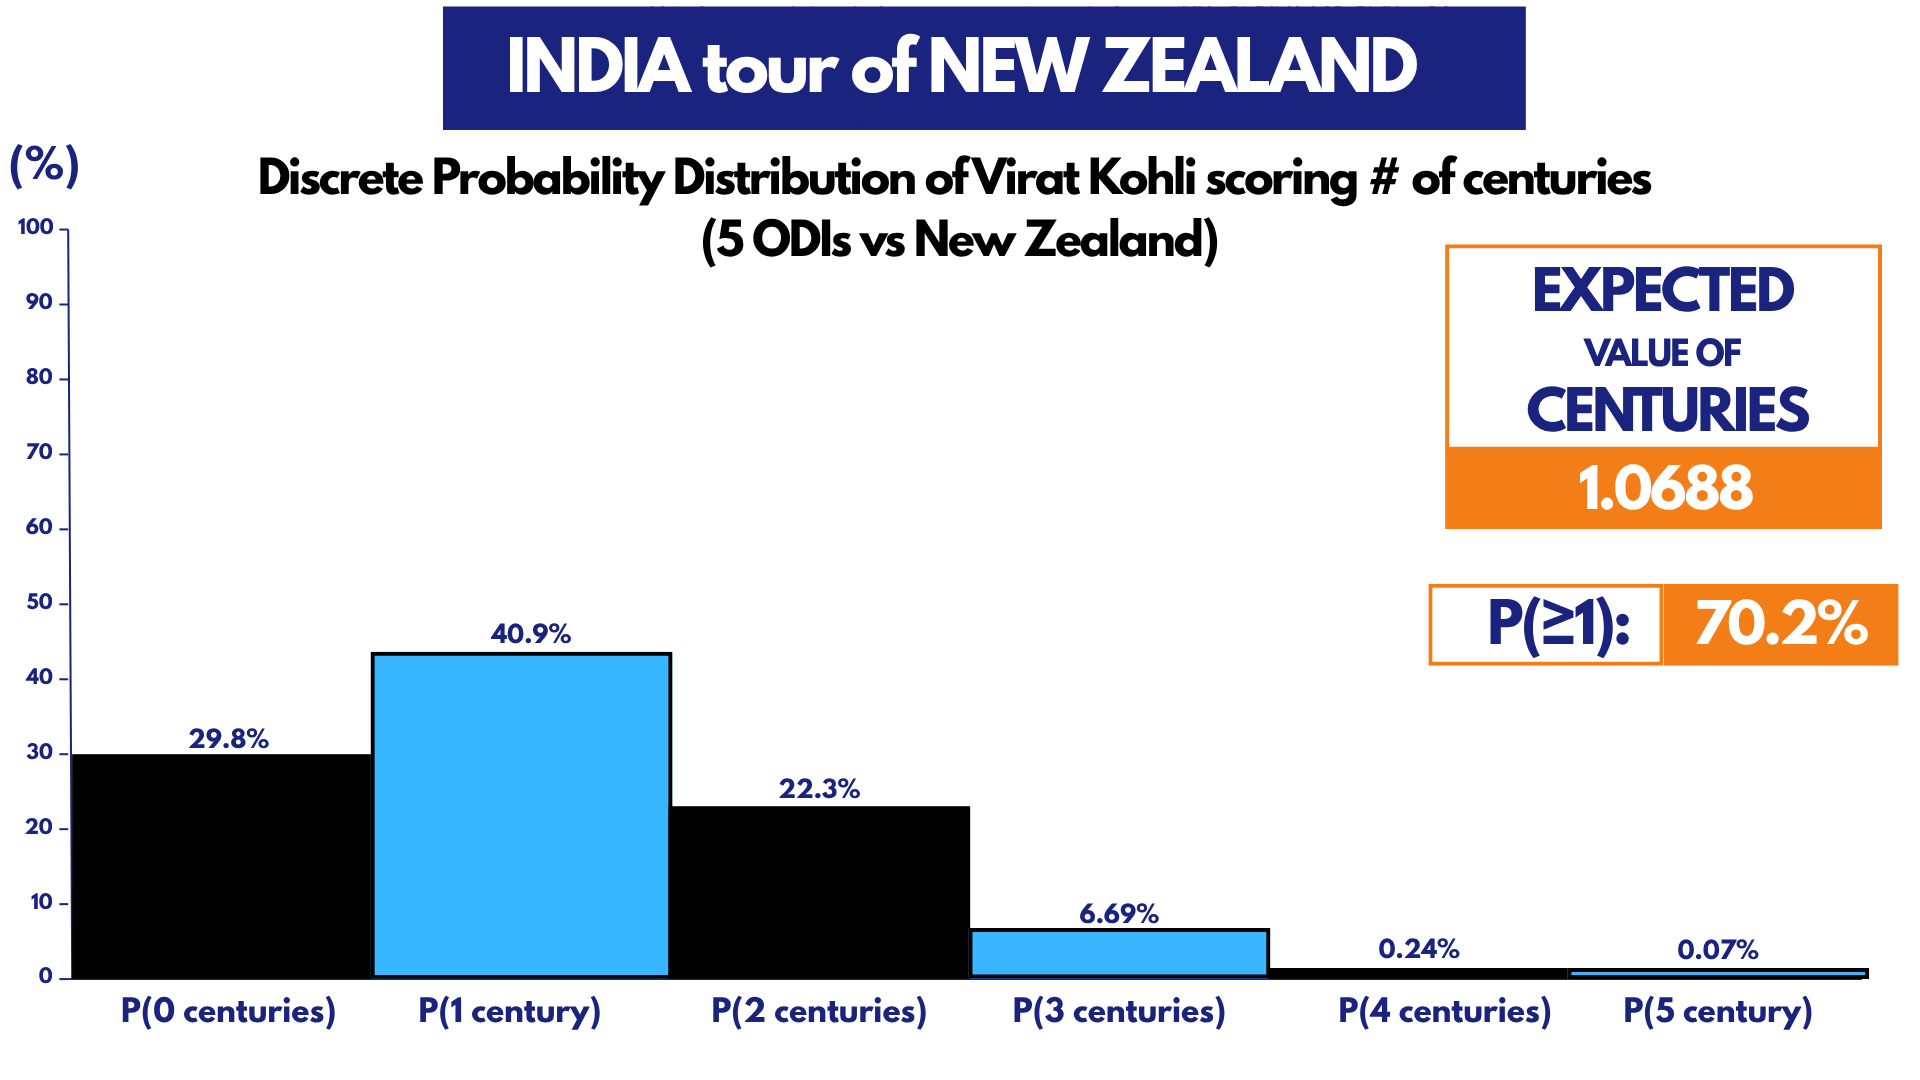
The three models simulate Kohli’s odds of scoring centuries in each game this series, with a verdict expecting 1.0688 centuries. Given the extra games this series to balance the more challenging conditions, the models also predict Kohli to have a 70.2% chance to score at least one century.
Interestingly, Kohli also has a surprisingly high 7% predicted chance to score 3 or more centuries in this series. Could we see Virat reach such new heights away from home?
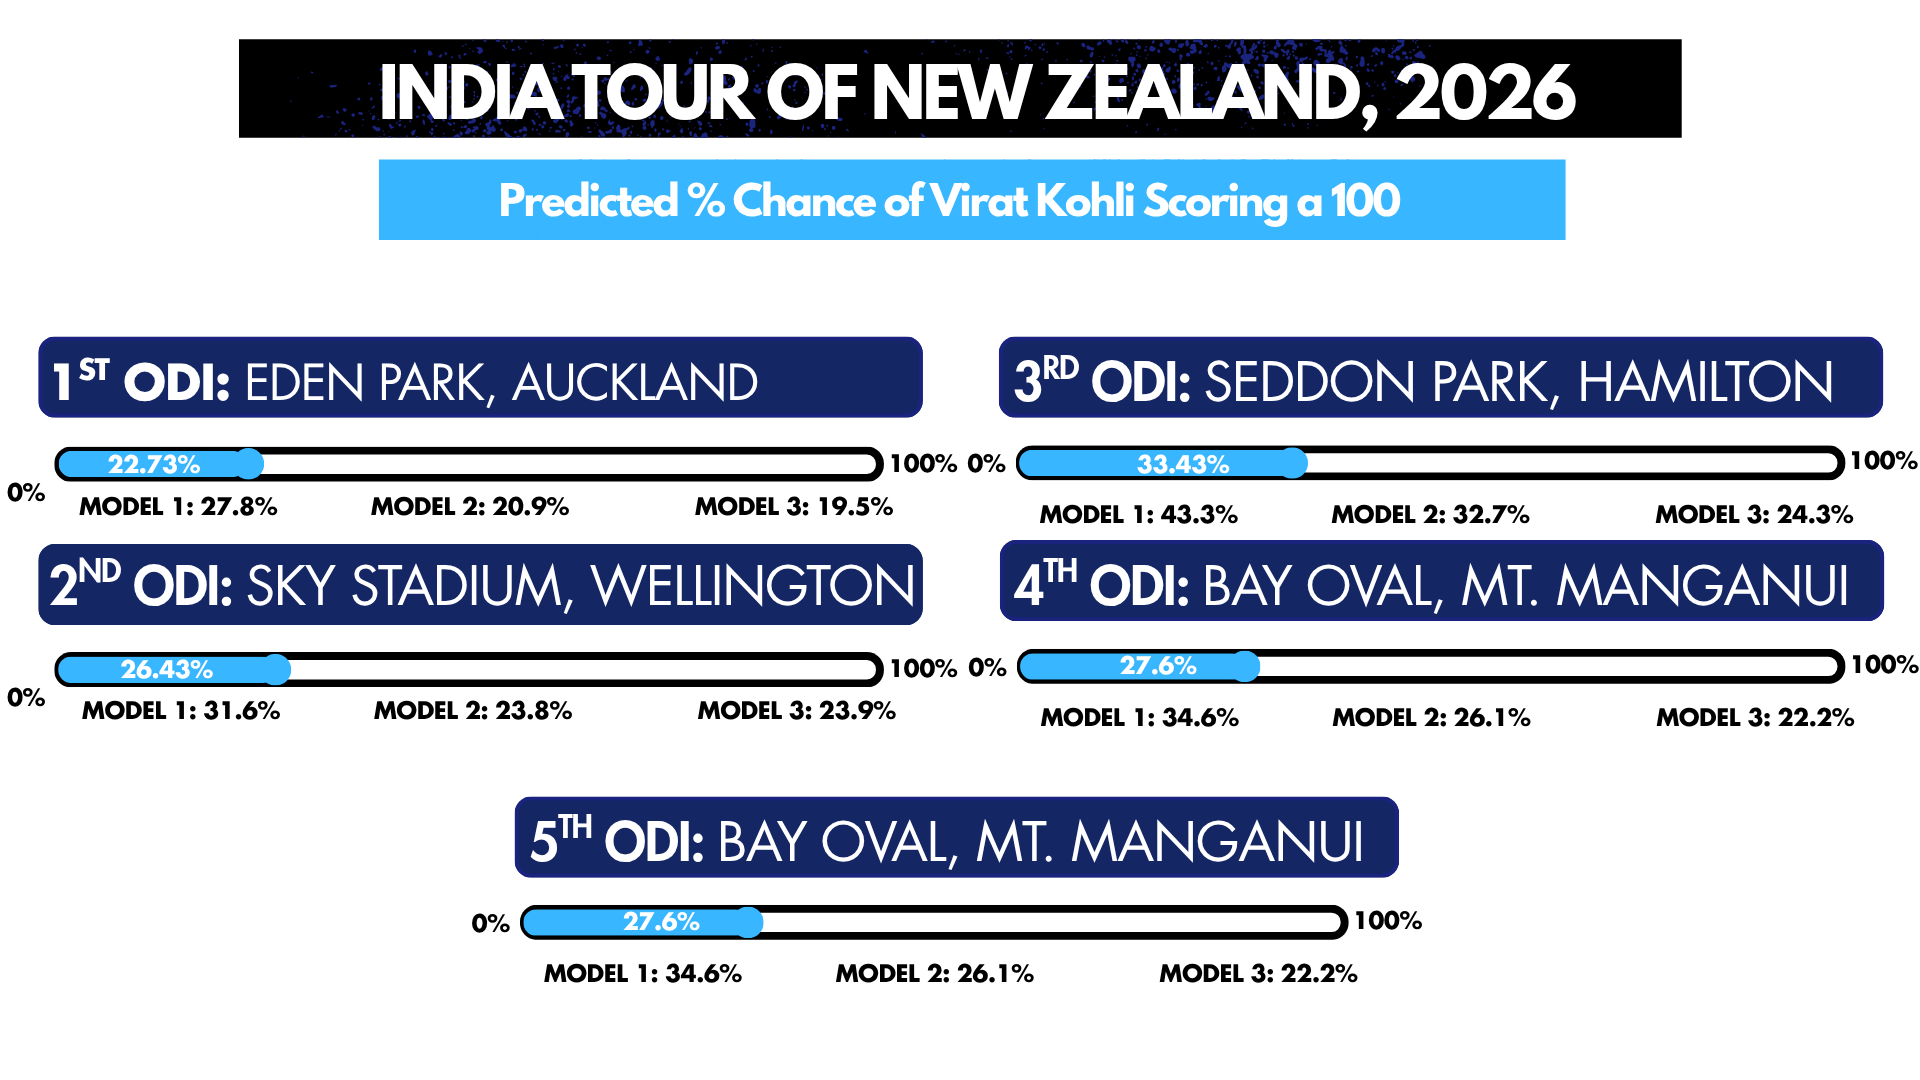
On average, the models predict Kohli to have the best odds of scoring a century in the 3rd ODI at Seddon Park. Among all venues in this series, he has the best history here, with two 50+ scores from three ODIs, averaging 43.66. Interestingly, Model 1 is the most bullish on Kohli for this series, having the highest predicted probability of scoring a century in each of the 5 ODIs.
Sri Lanka tour of India
Format: 3 ODIs (home)
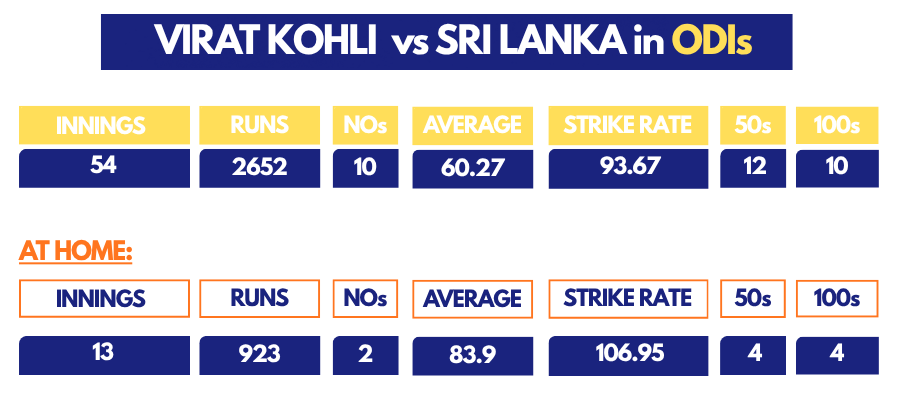
The last tour of the calendar year is Sri Lanka’s white ball visit to India in December. Kohli has scored 10 centuries against the Sri Lankans, the most he has against any one international side. He averages 60.27 in 54 innings against them. Only 13 of these innings have come at home, but he averages 83.47 with 4 centuries in these innings. His last outing against them wasn’t the most memorable, however, scoring just 58 runs across 3 innings in Sri Lanka. This was also the first bilateral ODI series in 27 years where Sri Lanka beat India, 2-0 in August 2024.
Although Dilshan Madhushanka has been a villain for India, picking up a fifer in one of his two games against India, it is actually young Dunith Wellalage who has the best matchup against Kohli, having dismissed him twice in 4 encounters. The left-armer even restricted Kohli to a boundary percentage of just 7.3%.
Eshan Malinga poses another threat for Kohli, and has been very impressive in his tenure for Sri Lanka, and in T20 leagues so far, particularly in IPL 2026. His change of pace and bowling into the surface won’t be something Kohli enjoys, particularly as he enjoys facing express pace and bounce.
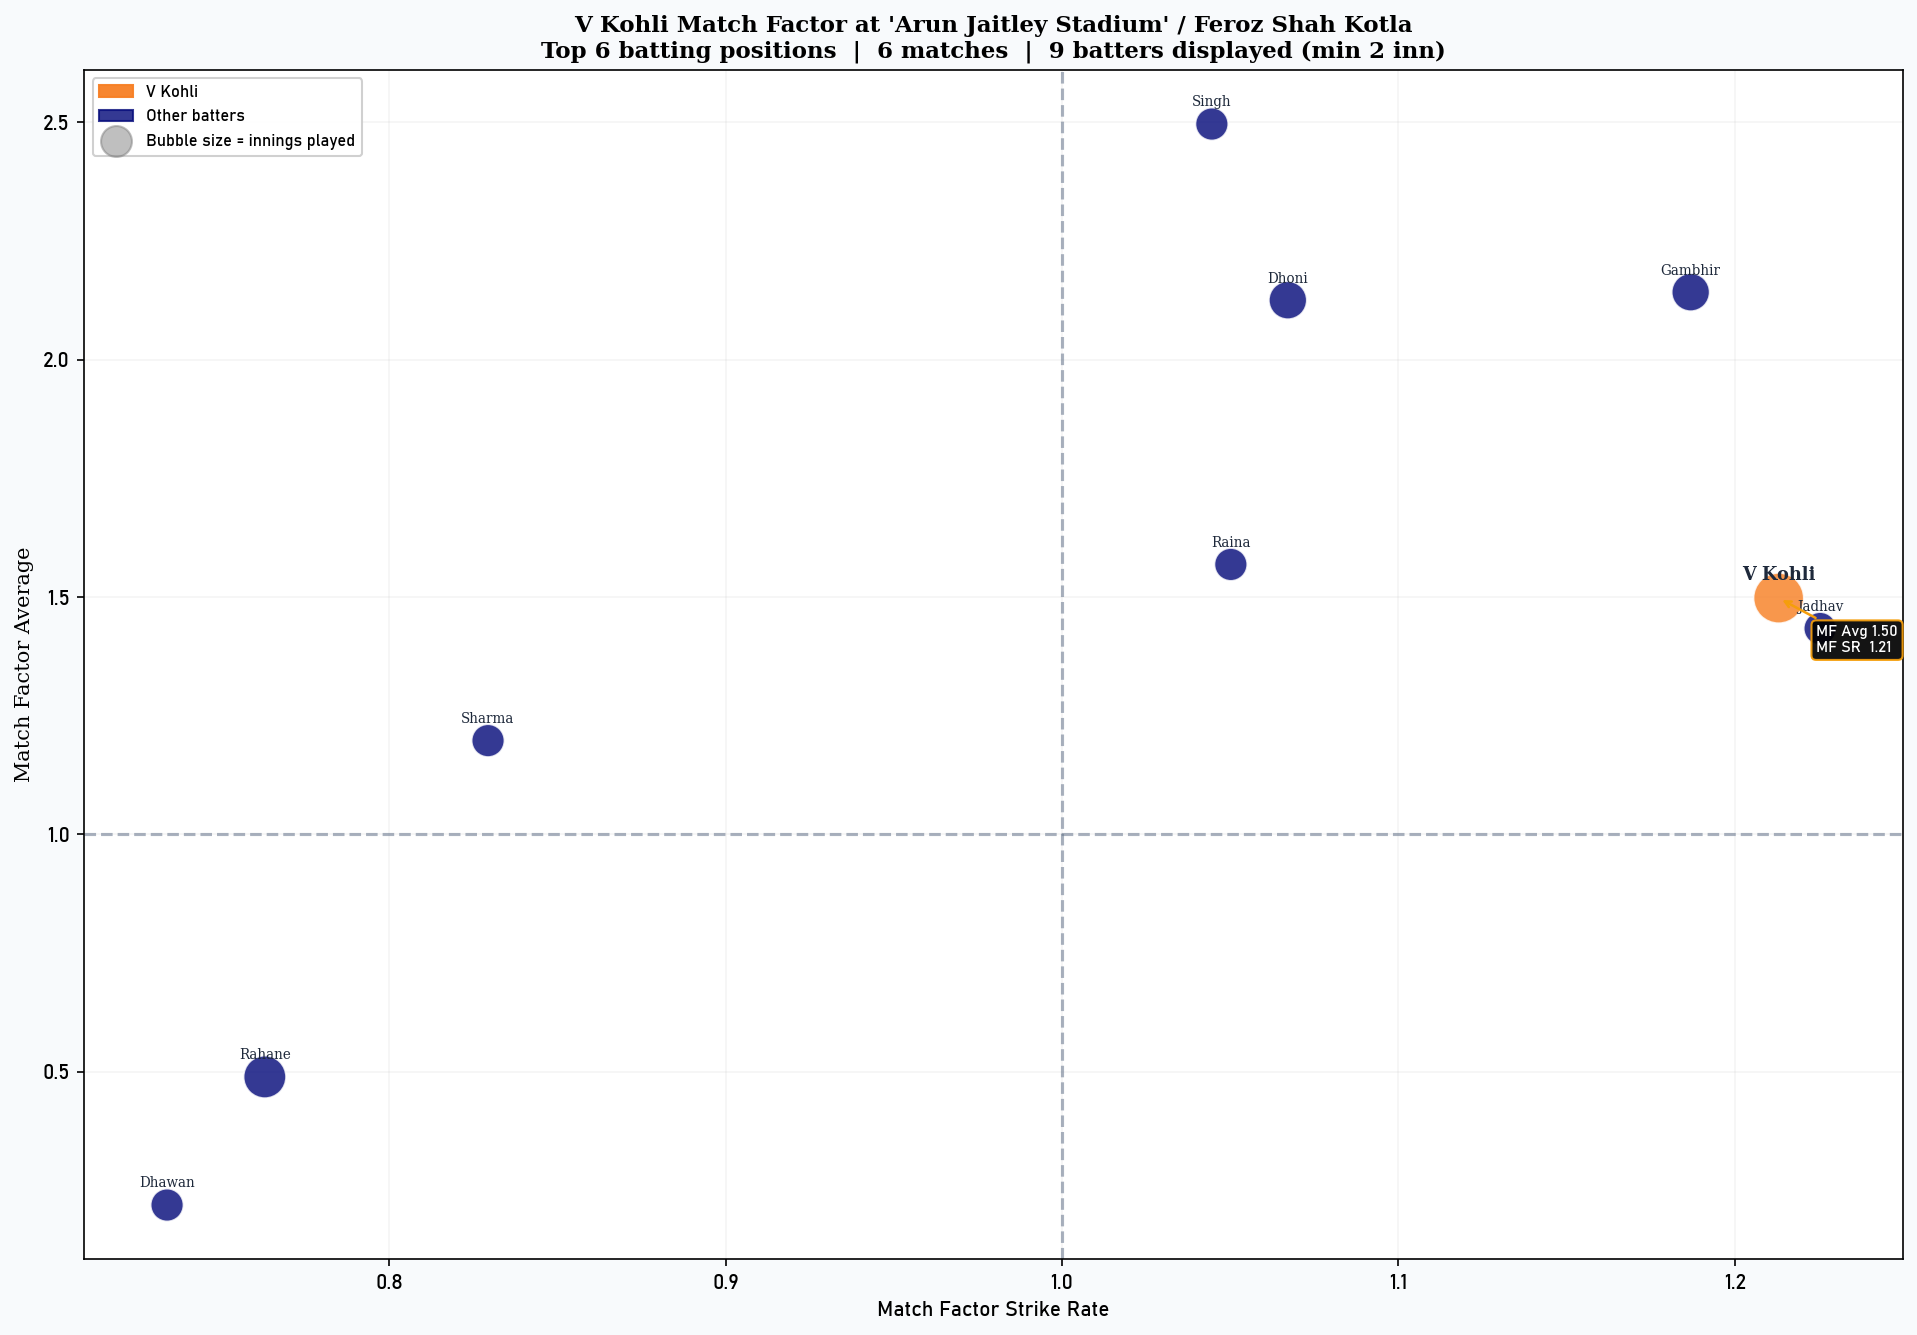
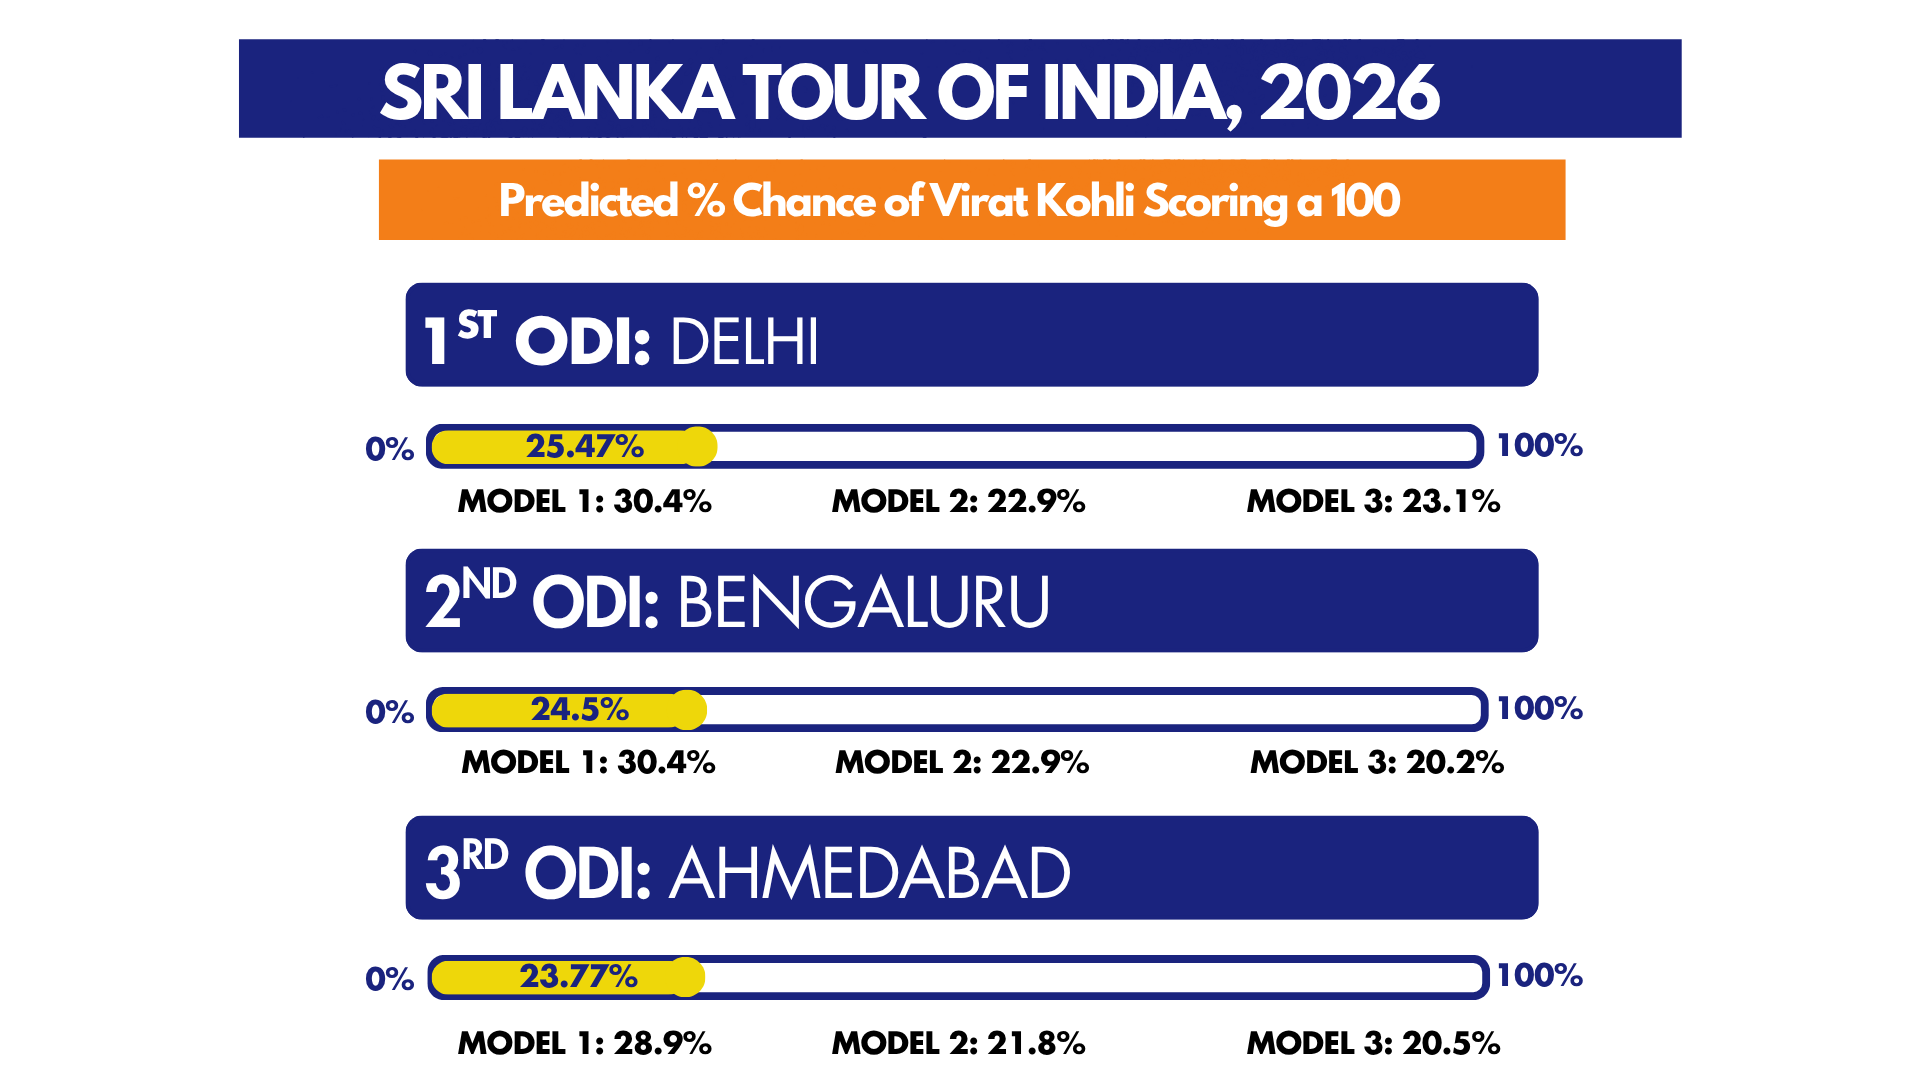
The first of 3 venues hosting Sri Lanka for ODIs this winter is the Arun Jaitley Stadium in Delhi - Kohli’s home ground. In 7 innings here, he averages 55.4, with two 50s and an unbeaten 100. Excluding his most recent ODI here, against Afghanistan in the 2023 ODI World Cup, Kohli averaged 50% better and struck 21% quicker than the average top 6 batter in his first 6 innings here. Although the stadium’s name may have changed from the Feroz Shah Kotla, Kohli’s production of runs in Delhi hasn’t changed whatsoever.
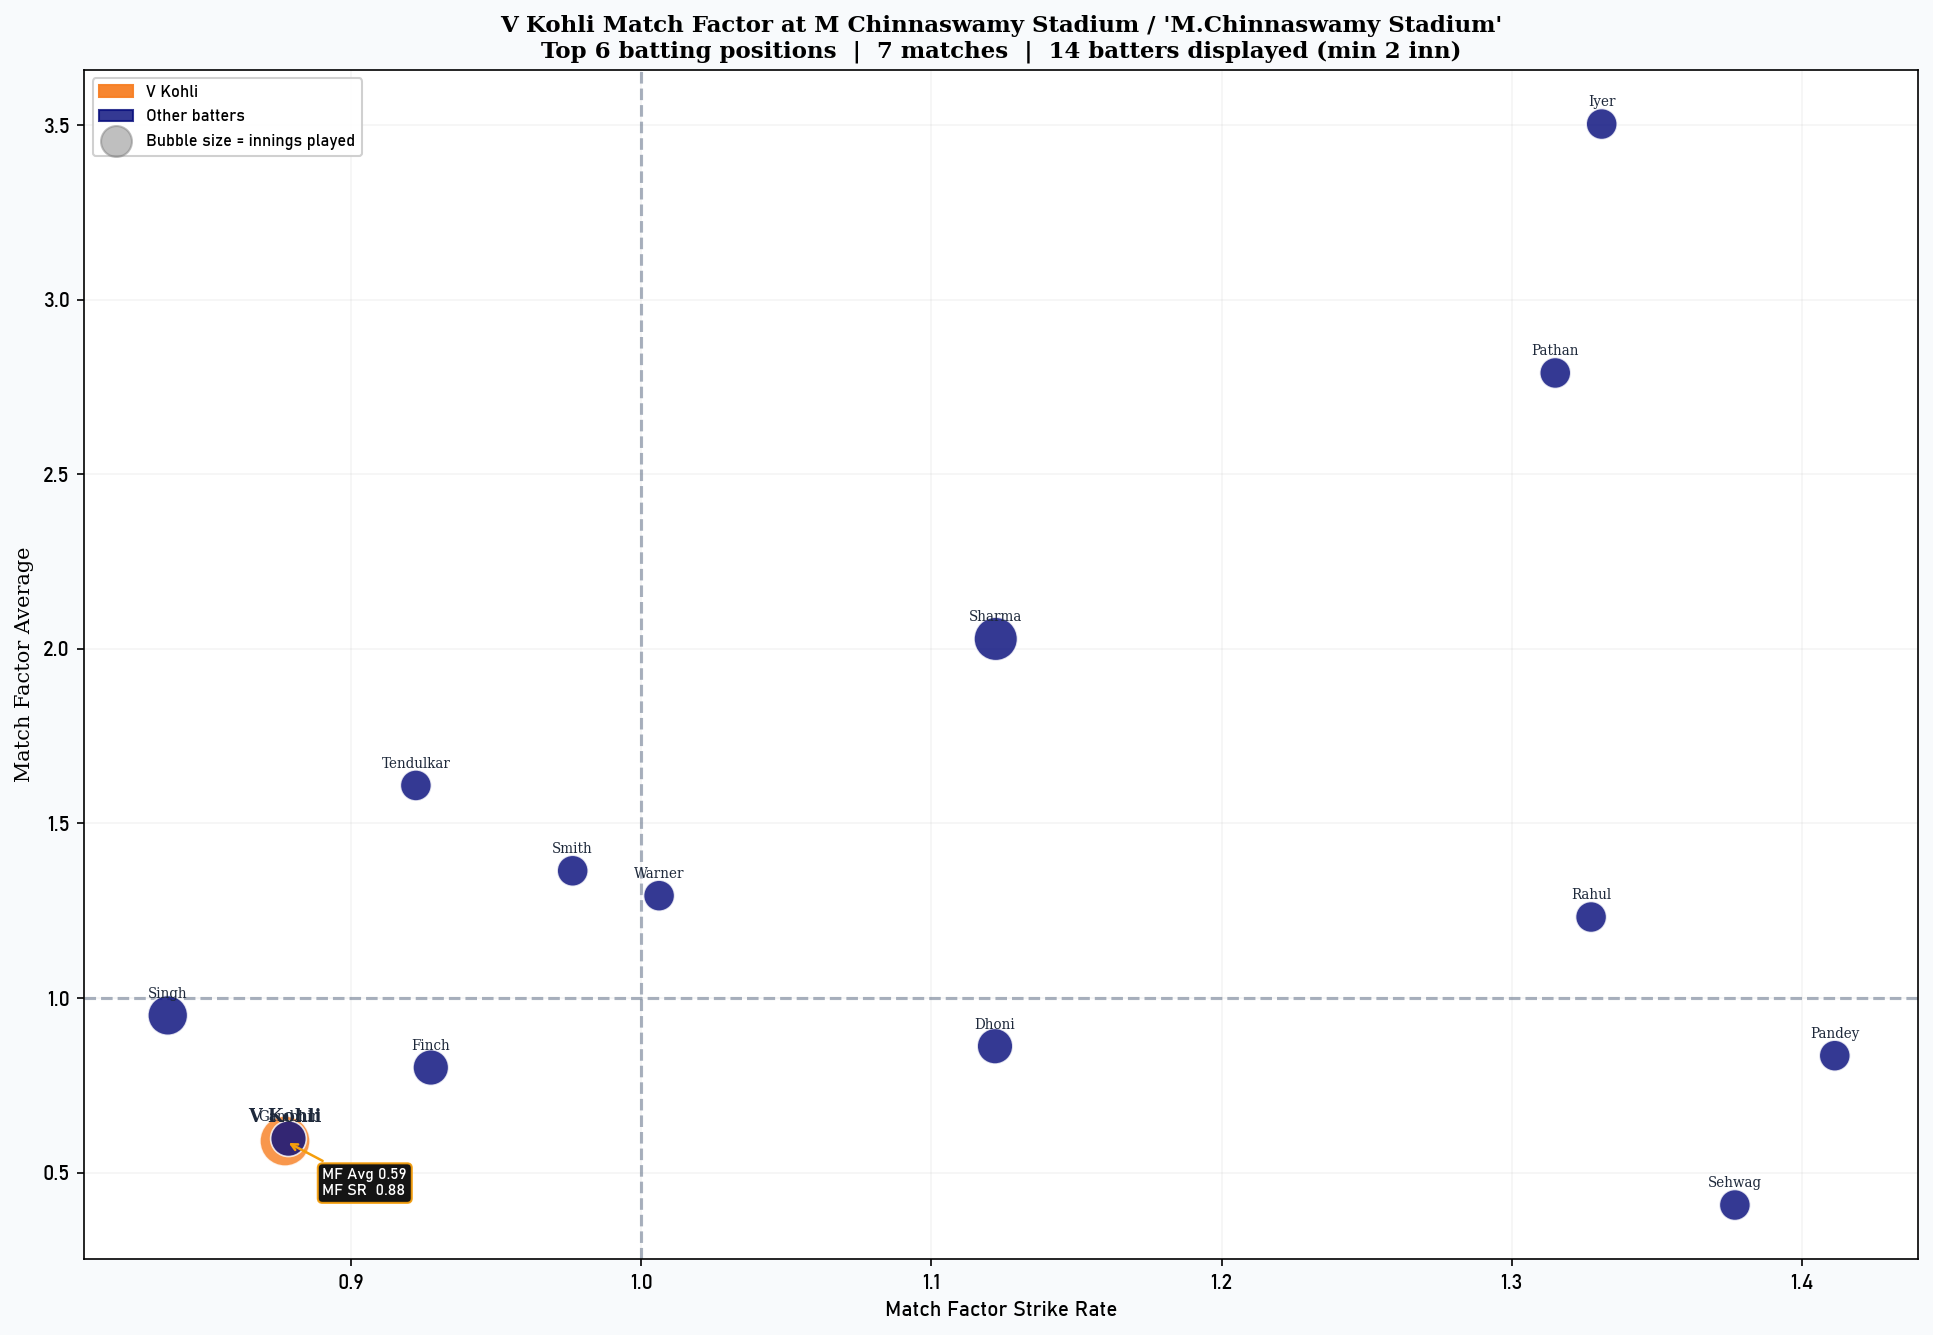
The second ODI will be hosted at M. Chinnaswamy Stadium, what many consider to be Kohli’s second home. Despite his exploits in the IPL, though, his ODI numbers in Bengaluru fail to flatter, averaging 29 across 7 innings with 203 runs, two 50s to go with two ducks. On match factor, he averages 41% worse and strikes 12% slower than the average top 6 batter in his games at the Chinnaswamy. However, he has only played 2 ODIs here in the last 6 years, both of which were his only two half-centuries at the venue, including his high-score of 89.
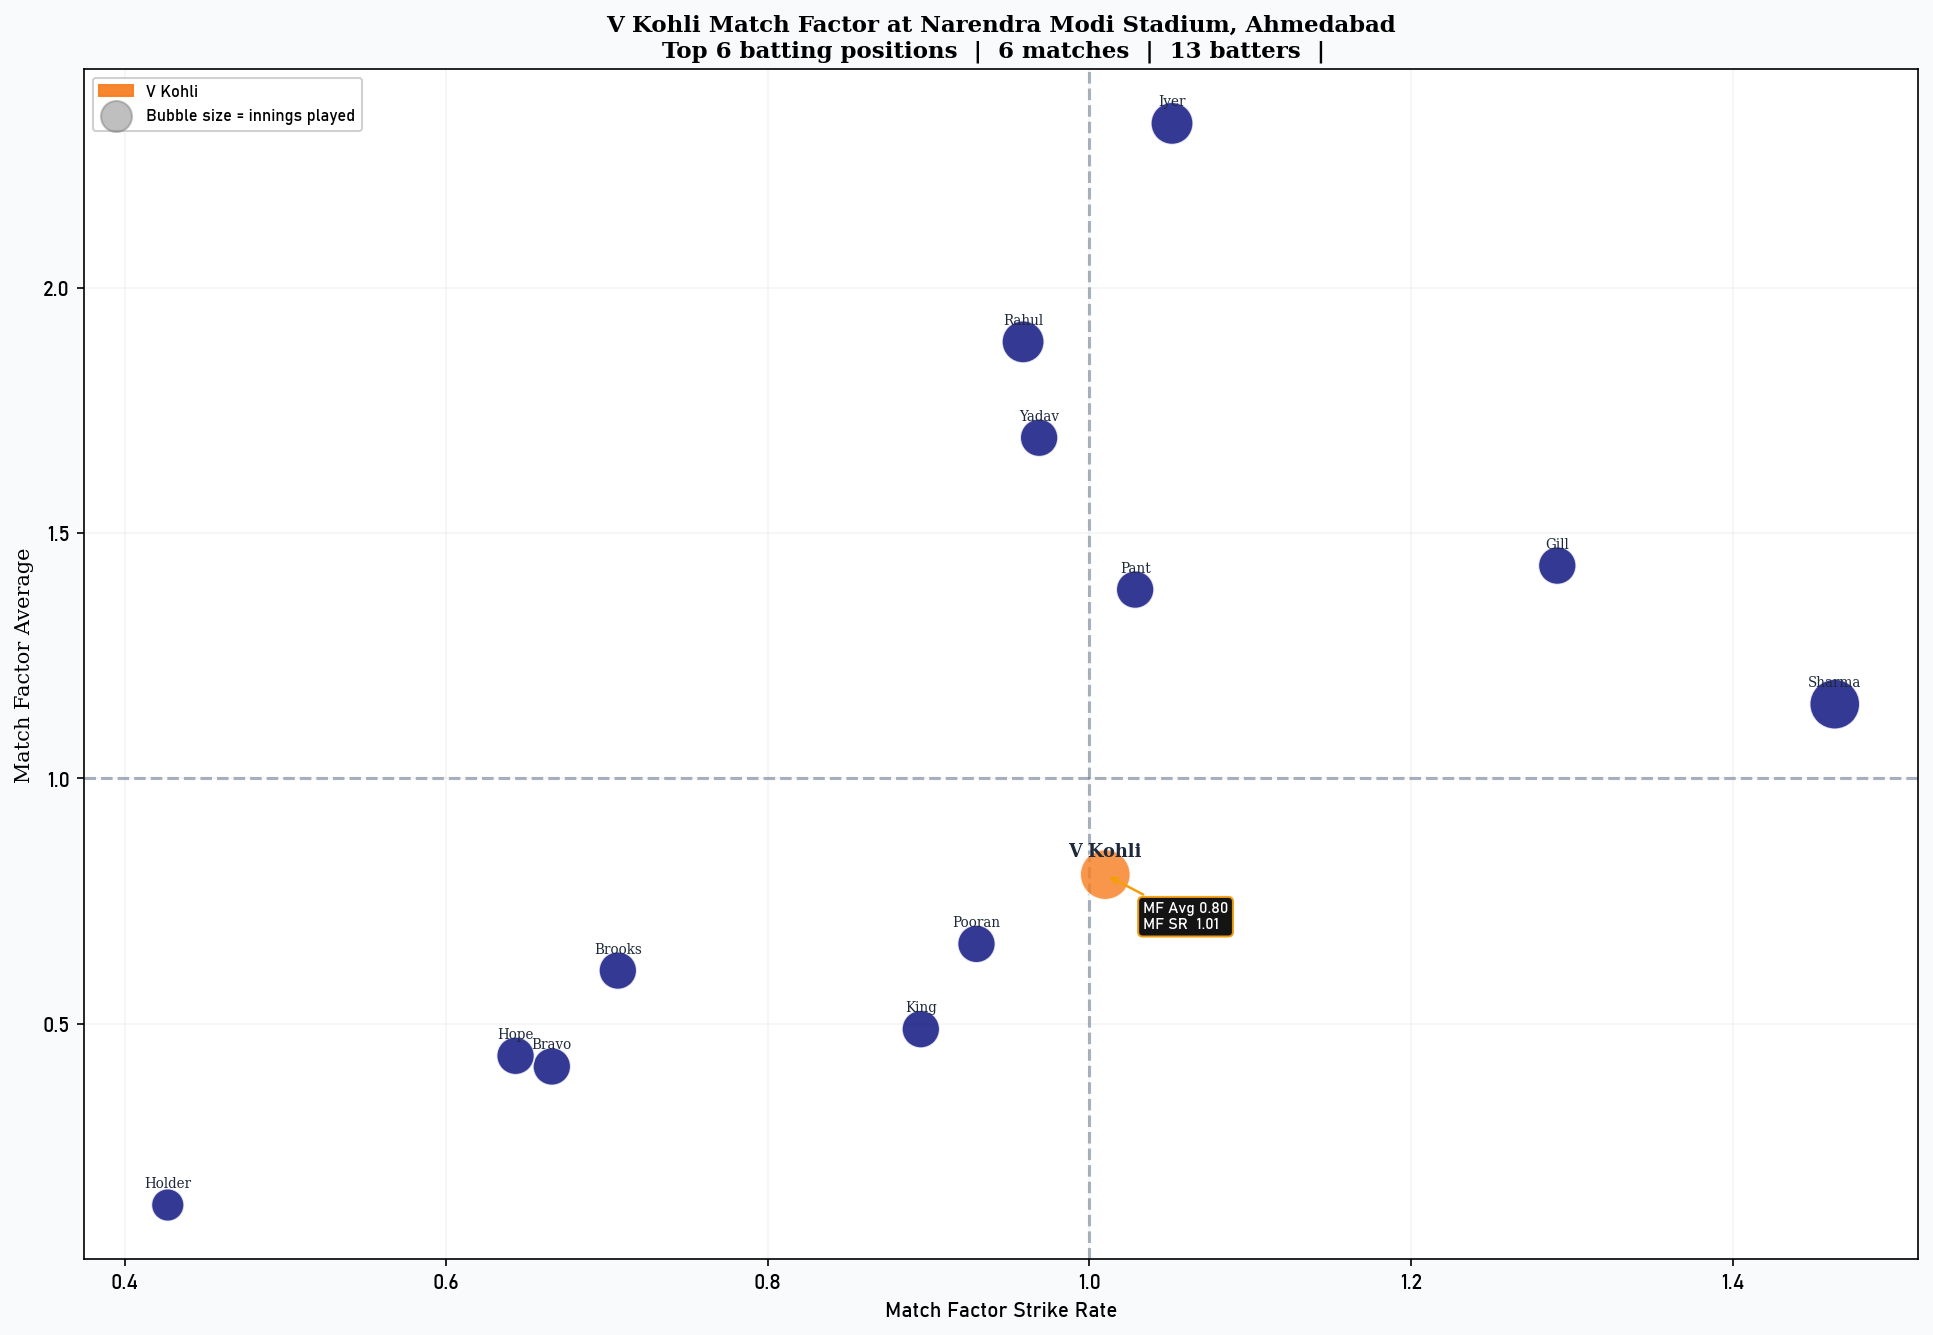
The series concludes in Ahmedabad, where in 6 innings at the Narendra Modi stadium, Kohli managed just 148 runs averaging 24.66. His last two games here produced his only two half-centuries here, striking at 86.0 in those innings. His strike rate here is close to par, 1% quicker than the average top 6 batter in his games, but he averages 20% worse.
Within the probability distribution, the models had a modest prediction of only a 50% chance of Kohli scoring at least one century in this series. Moreover, his expected value of centuries is just 0.62 in this series, despite his strong historical numbers against Sri Lanka at home. This comes from weighted matchups against some of the likely Sri Lankan bowlers across formats, bringing expectations down.
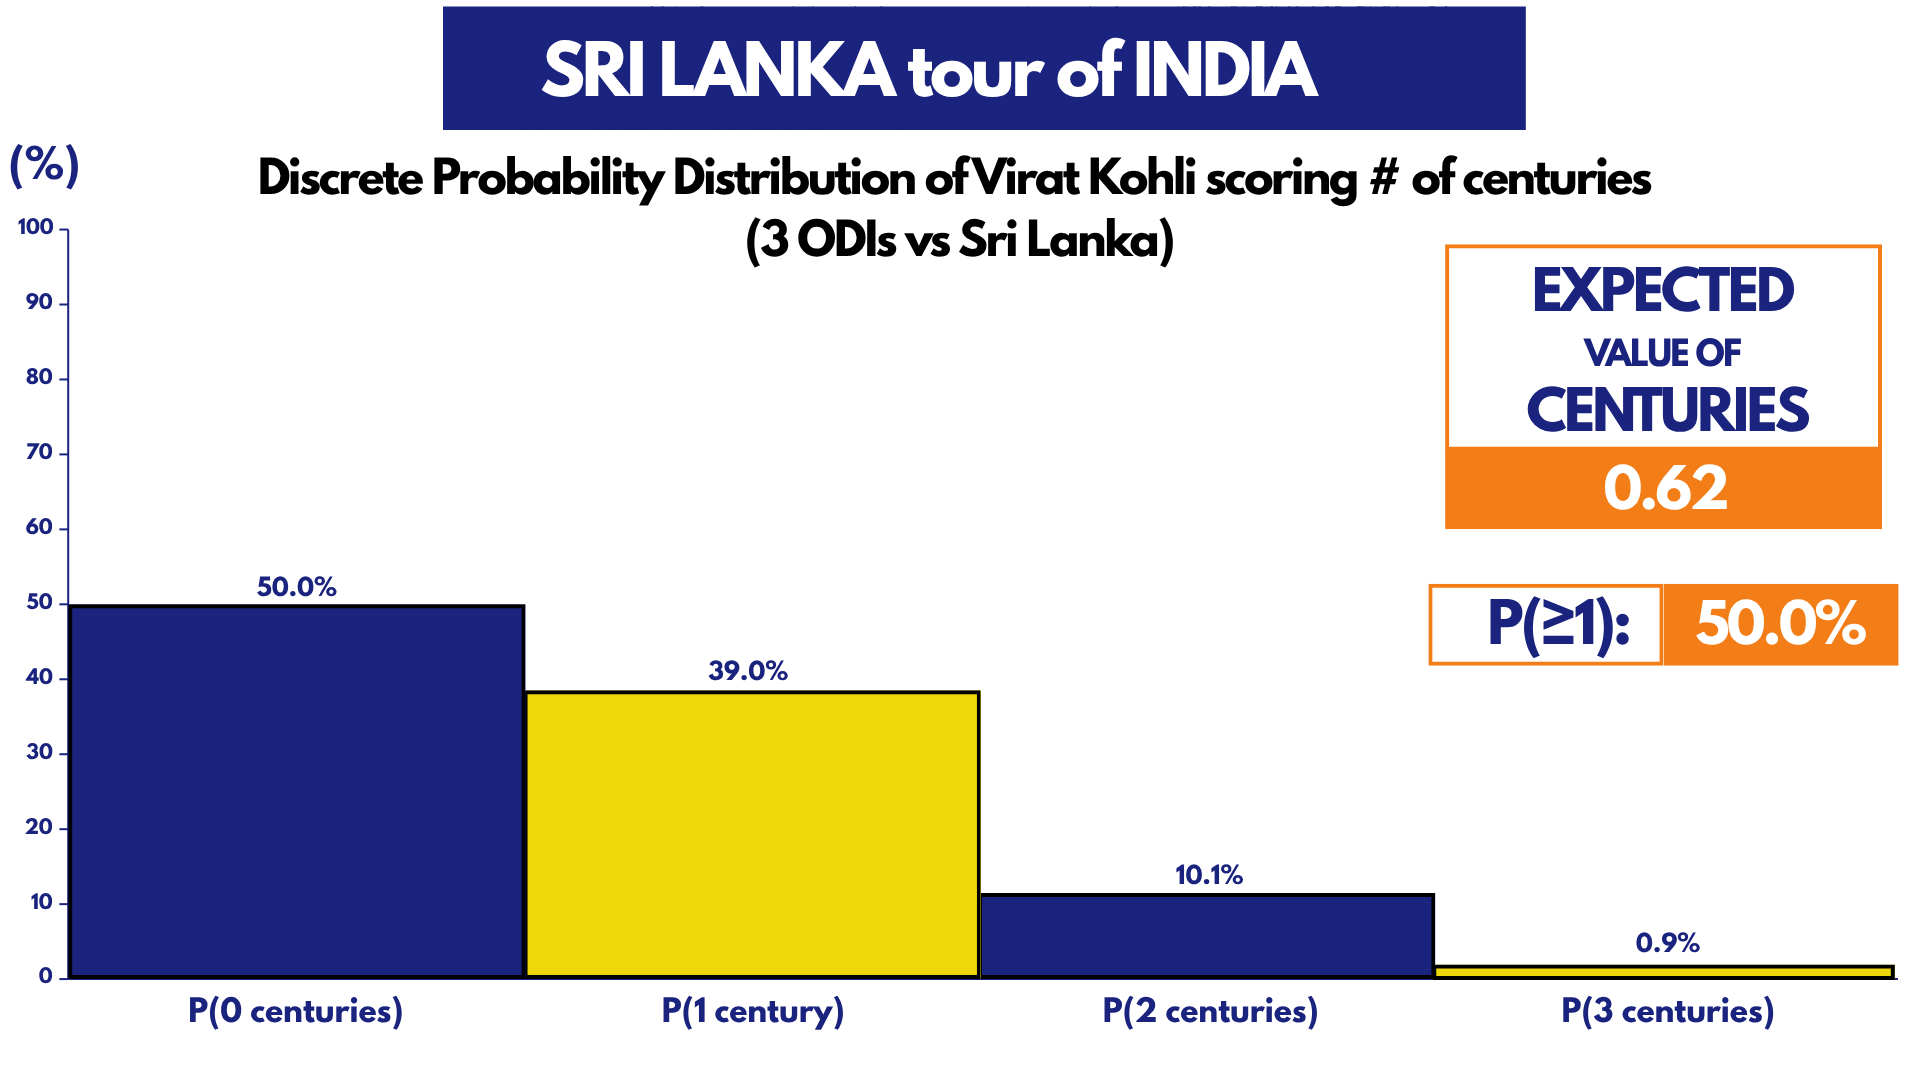
All 3 ODIs in this series are given similar average odds from the three models, of Kohli scoring a century, with his highest predicted chances of 25.47% being at Delhi. However, Kohli’s newly positive batting approach will likely push him further in this series, enhancing his batting against Sri Lanka’s bowling attack on pro-batting surfaces.
Zimbabwe tour of India
Format: 3 ODIs (home)
Lastly, in early 2027, Zimbabwe is set to tour India for 3 ODIs. Kohli has played just 8 games and 6 innings against Zimbabwe, the last of which came in 2015. However, he averages 50 in these innings, with 1 century.
This means, of course, that Kohli hasn’t had the opportunity to face Zimbabwe’s frontline pace duo of skipper Richard Ngarava, and Blessing Muzarabani. In the last 3 years, Ngarava has 26 wickets in 15 innings, averaging just 22.07. Muzarabani has shined too, particularly in red ball cricket, picking up 48 wickets in his last 11 tests averaging 25.8 since 2025. His performances even earned him a maiden IPL call up as a replacement for the Kolkata Knight Riders in 2026.
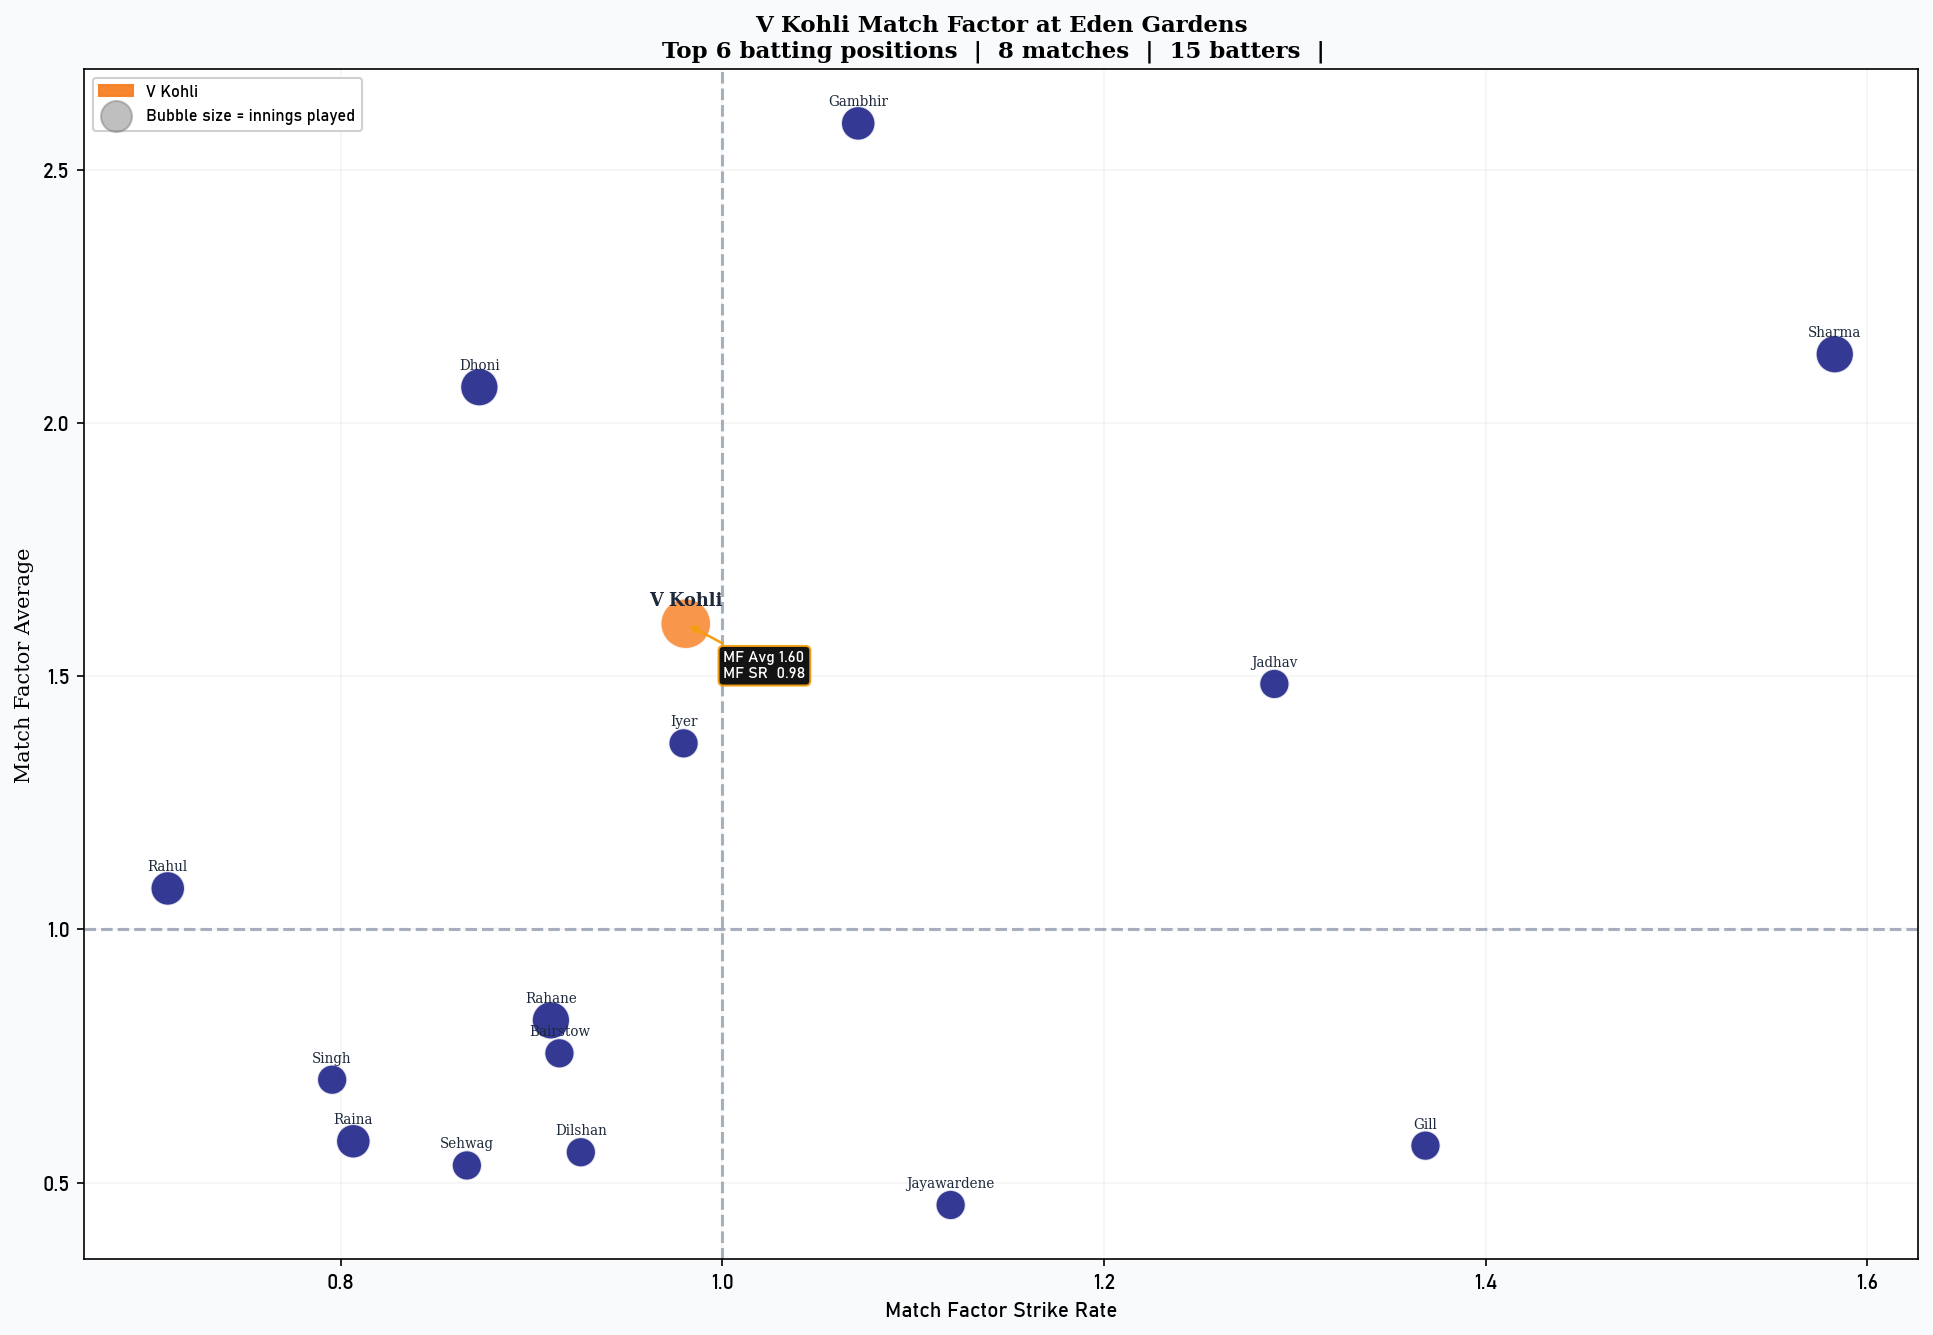
Kohli, though, will be pleased with the venues he is set to play at during this series. We begin at the Eden Gardens, where from 8 innings, Kohli has 431 runs at an average of 61.6, to go with 2 centuries, one of which came from his last game here against South Africa in the 2023 Cricket World Cup. On match factor, although Kohli scores at a rate 2% below par relative to the top 6 batters in his games here, he averages 60% better.
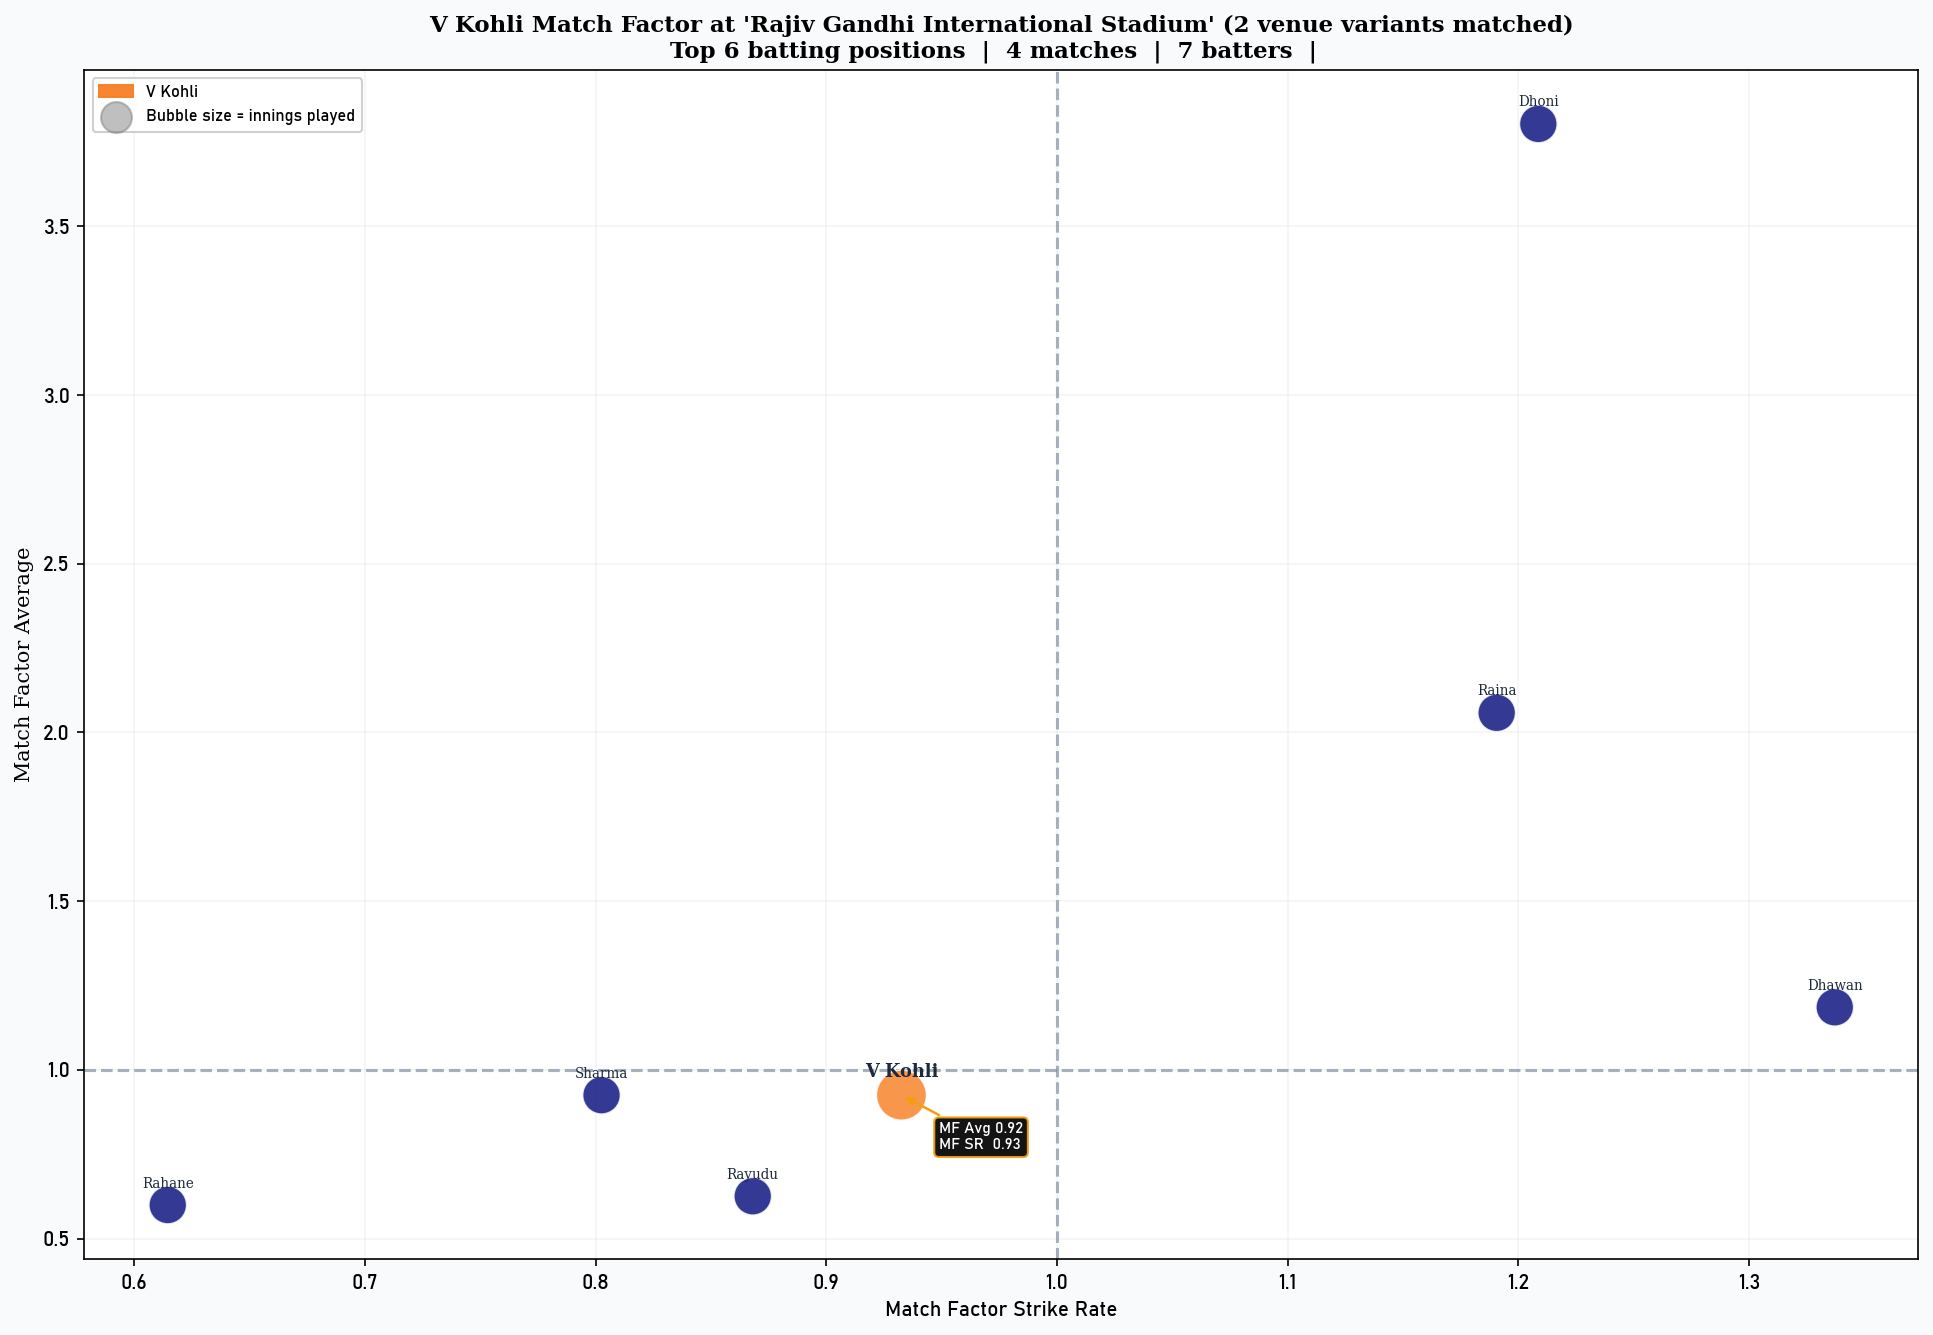
We then move to Hyderabad for the second ODI, where Kohli averages 35.5 in 4 innings, with one 50. His numbers on match factor aren’t too flattering either, as he averages 8% below and strikes 7% below par in his games here. However, the track here has favoured batting teams in recent years, particularly in T20 cricket, and the batters will look to tee off in this game.
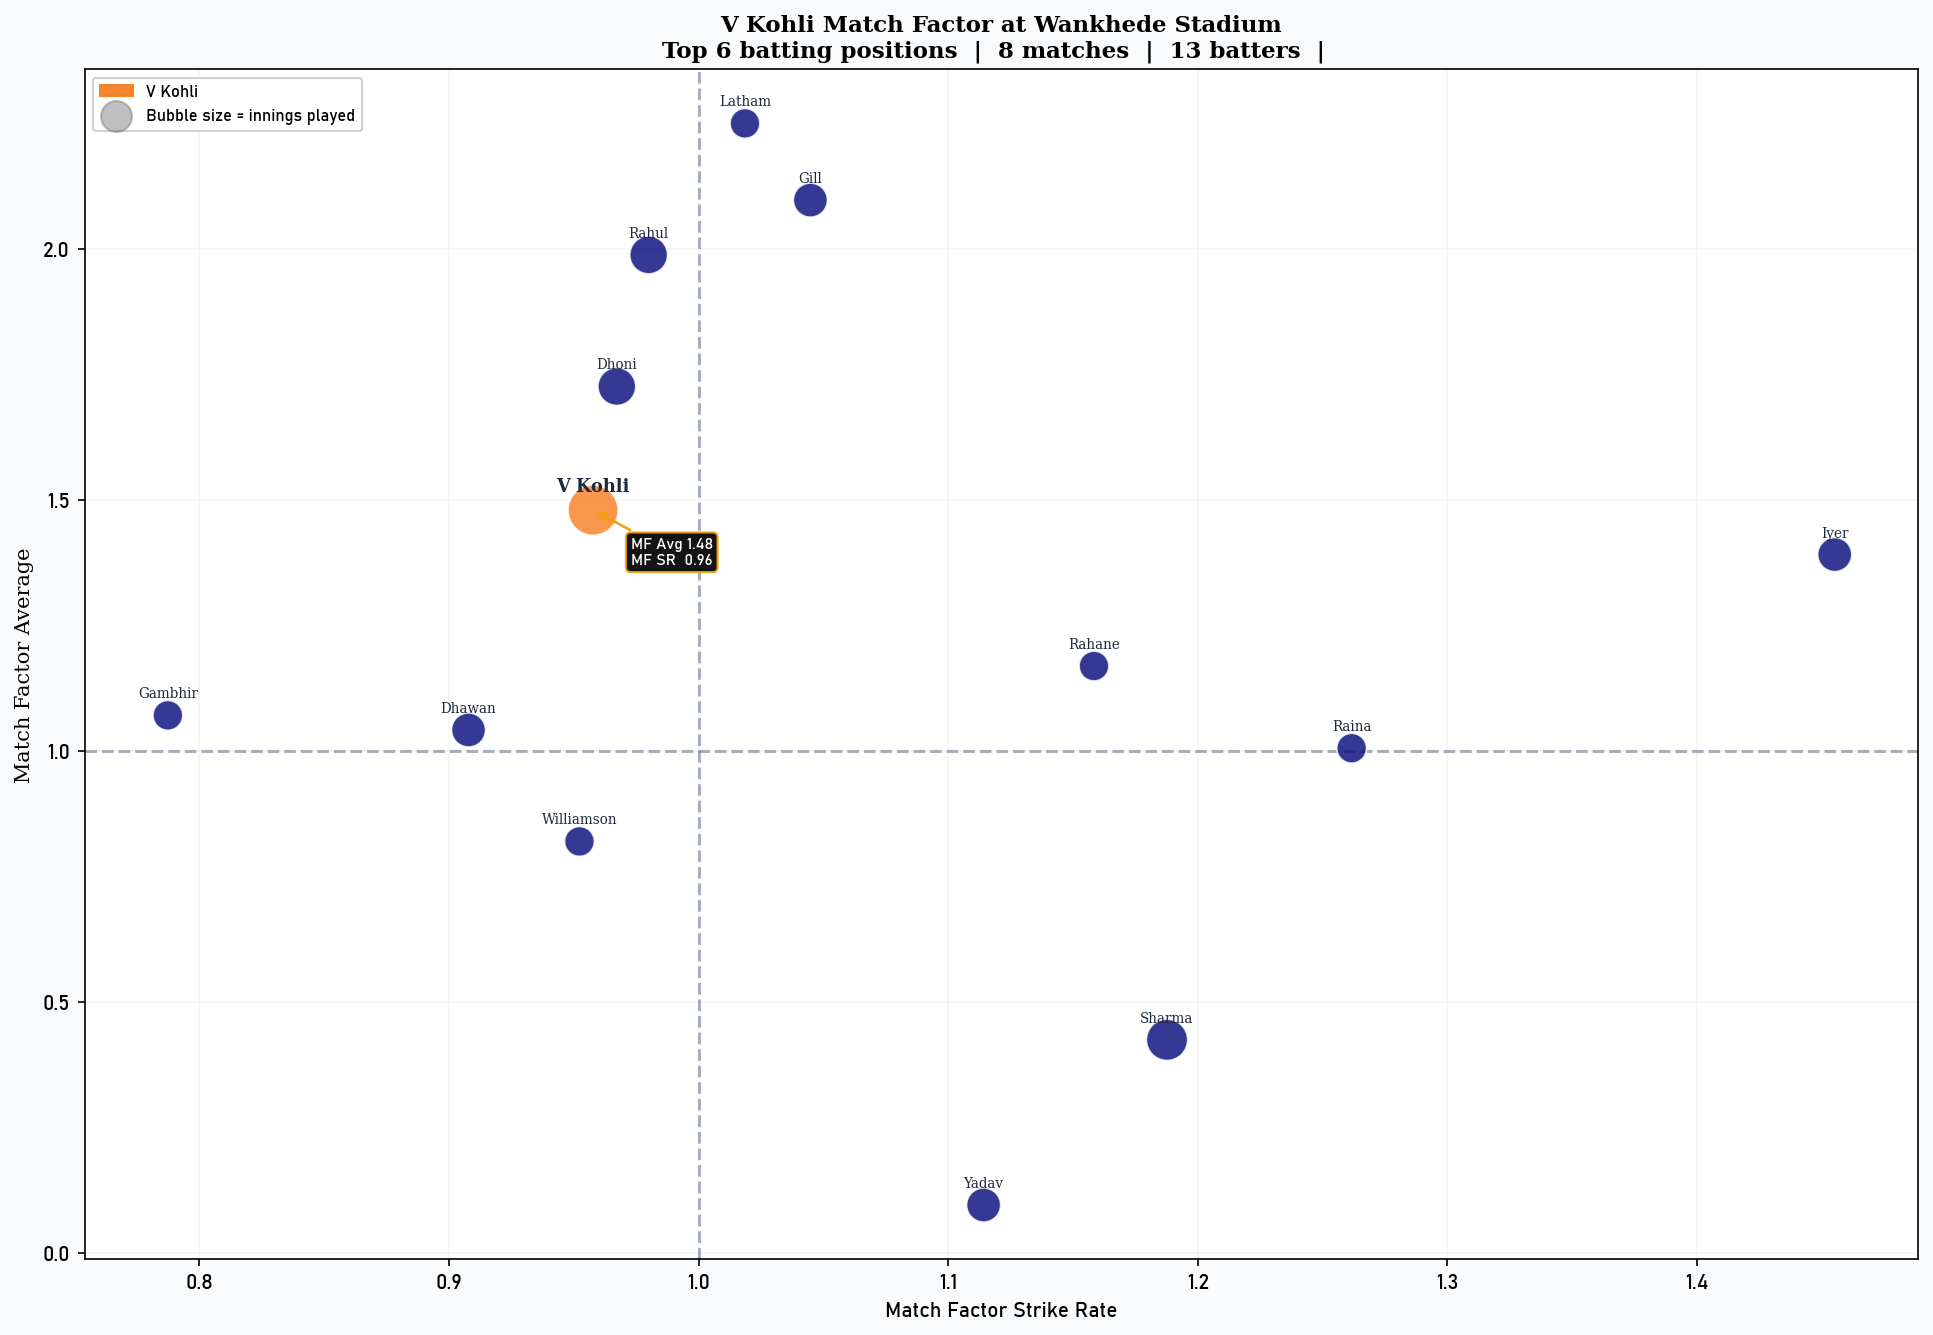
The final ODI of this series and of Kohli’s upcoming fixtures is at the Wankhede, the same ground where Kohli overtook Sachin to record 50 ODI centuries. He averages 67.7 in 8 innings in Mumbai, with 2 hundreds and 20 half-centuries. Similar to his numbers in Kolkata, although he strikes slightly below par here with a match factor strike rate of 0.96, he averages 48% better than the other top 6 batters in his 8 innings here.
This will be a cinematic finish to Kohli’s next 17 ODIs. Could the King reach his 100th century here?
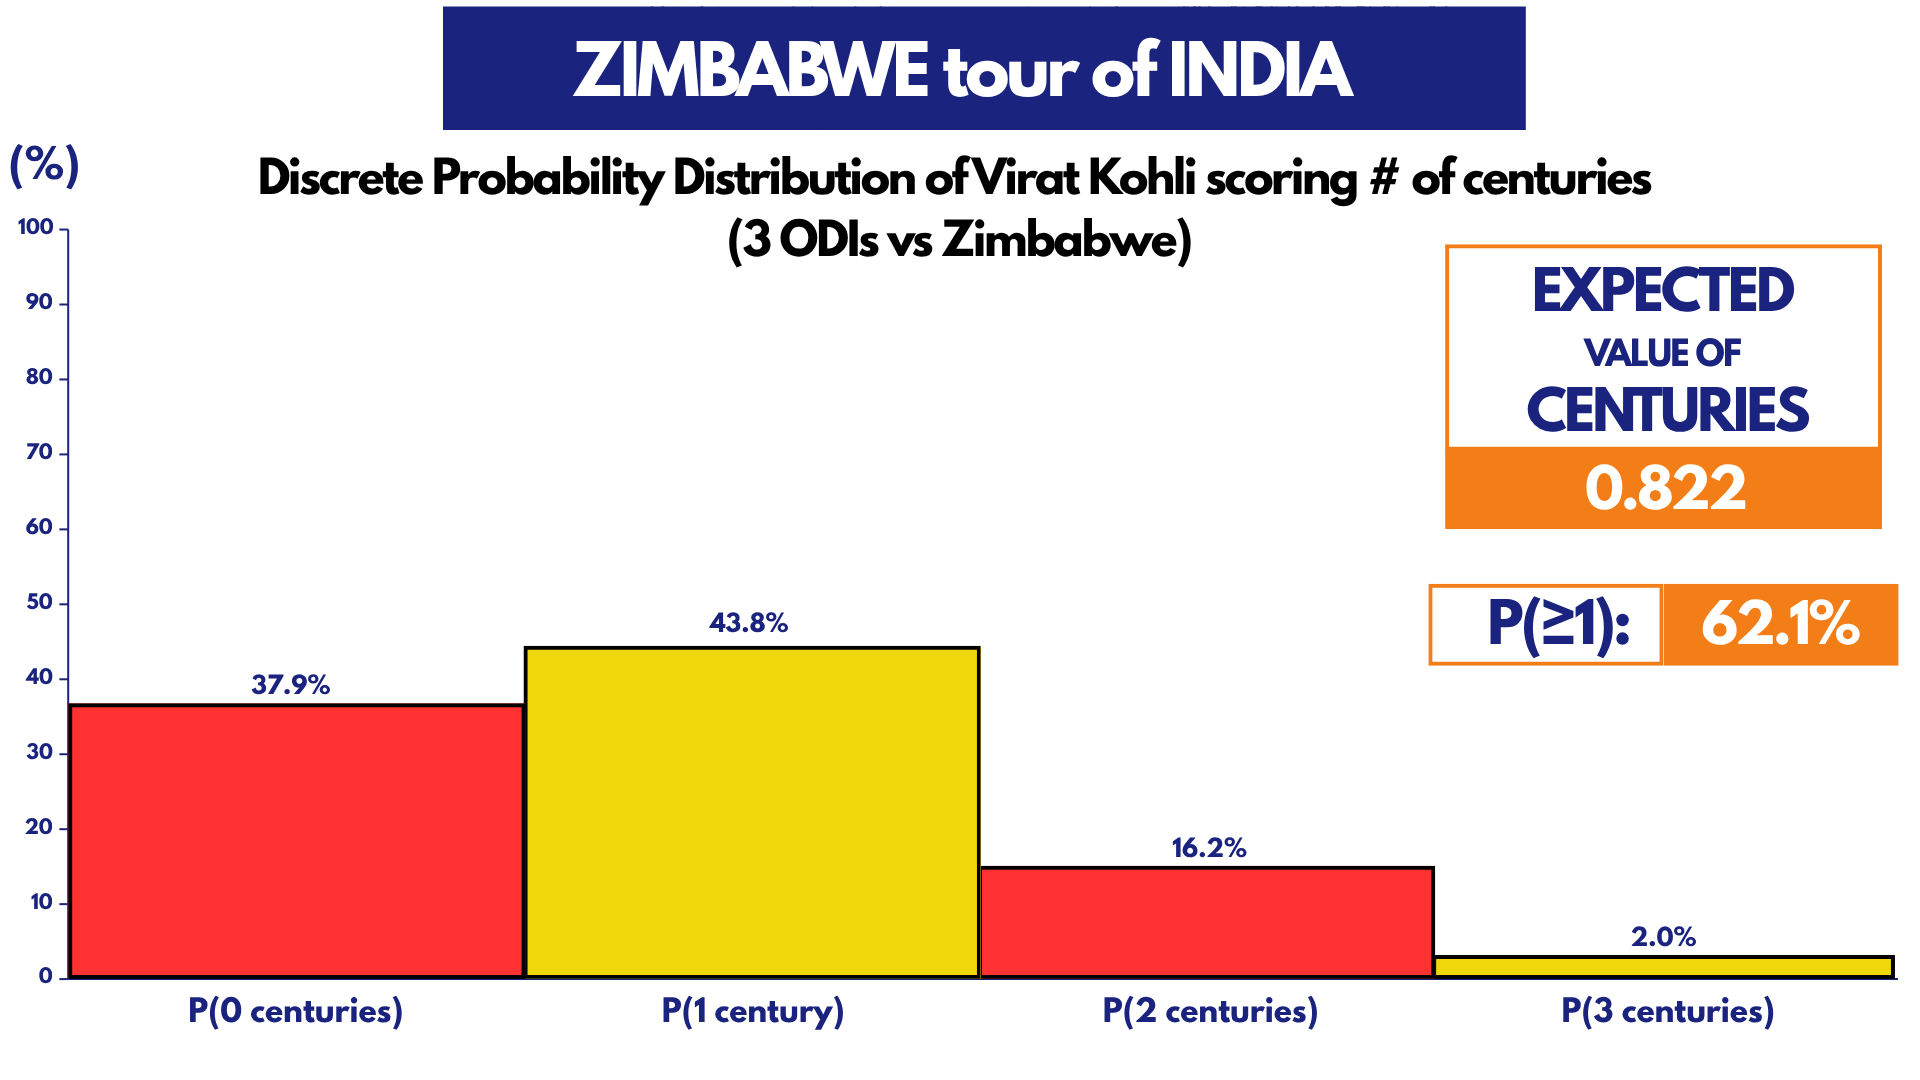
The models give Kohli an expected 0.82 centuries, with a 62.1% probability of scoring at least one ton during the three-match series. However, similar to the Sri Lanka series, if Kohl is able to maintain his recent form up until this series, his punishing batting approach would put the pressure back onto Zimbabwe’s bowling attack, who have little experience playing India in India.
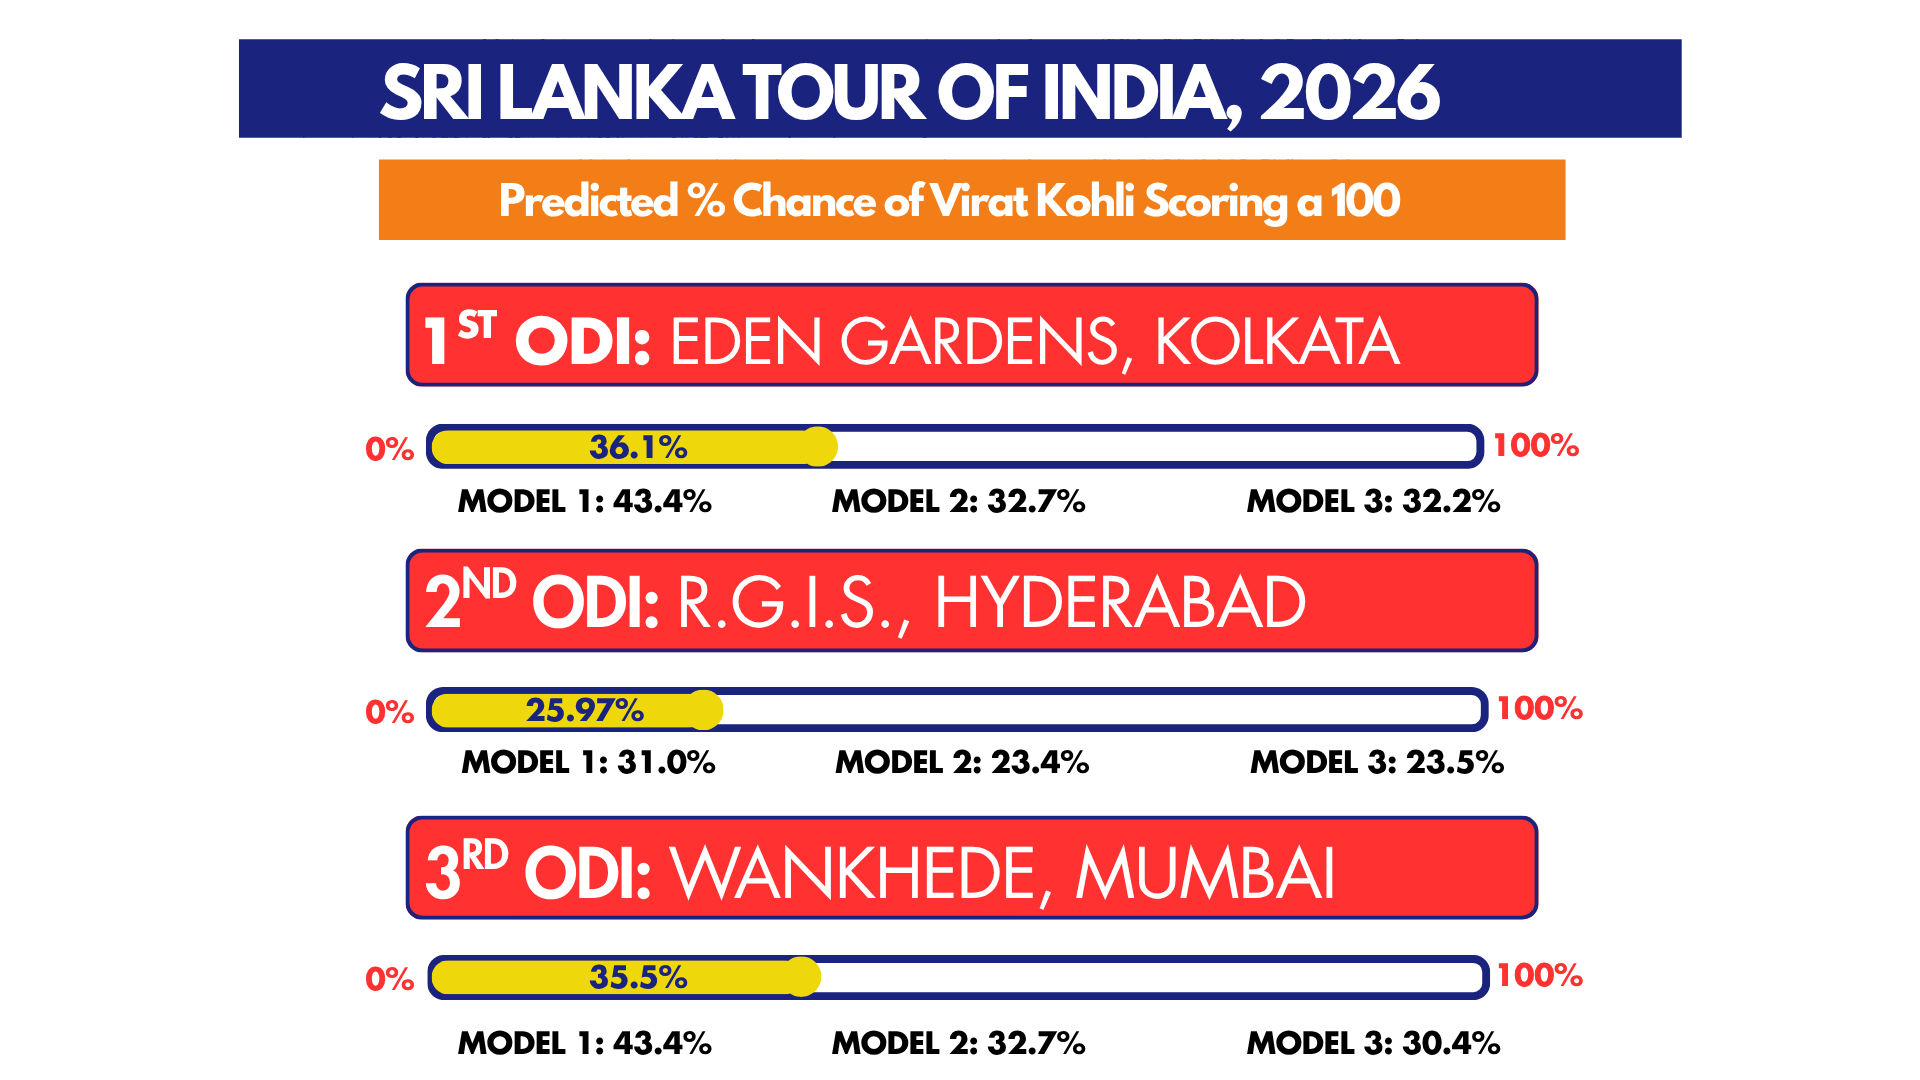
By games, the models predicted Kohli to, on average, have over a 35% chance of scoring a hundred in the first and third ODIs in Kolkata and Mumbai respectively. Notably, models 2 and 3 had prominently similar predictions for all three games, more so than in the other series.
Overall Predictions
Where does this leave Virat Kohli? After consolidating all the predictions for each game, here are the accumulated numbers from the three models.
The models expect Kohli to score another 3.89 centuries in the upcoming 17 announced ODIs. This means if he were to finish his career after the Zimbabwe series, he would finish on approximately 89 international centuries, 11 short of Tendulkar’s record.
Moreover, nearly 4 centuries in 17 games means a century every 4.25 games, an incredibly impressive record that beats Kohli’s career numbers of a century approximately every 5.53 games. To sustain that streak over 5 series would be a ridiculous feat in itself.
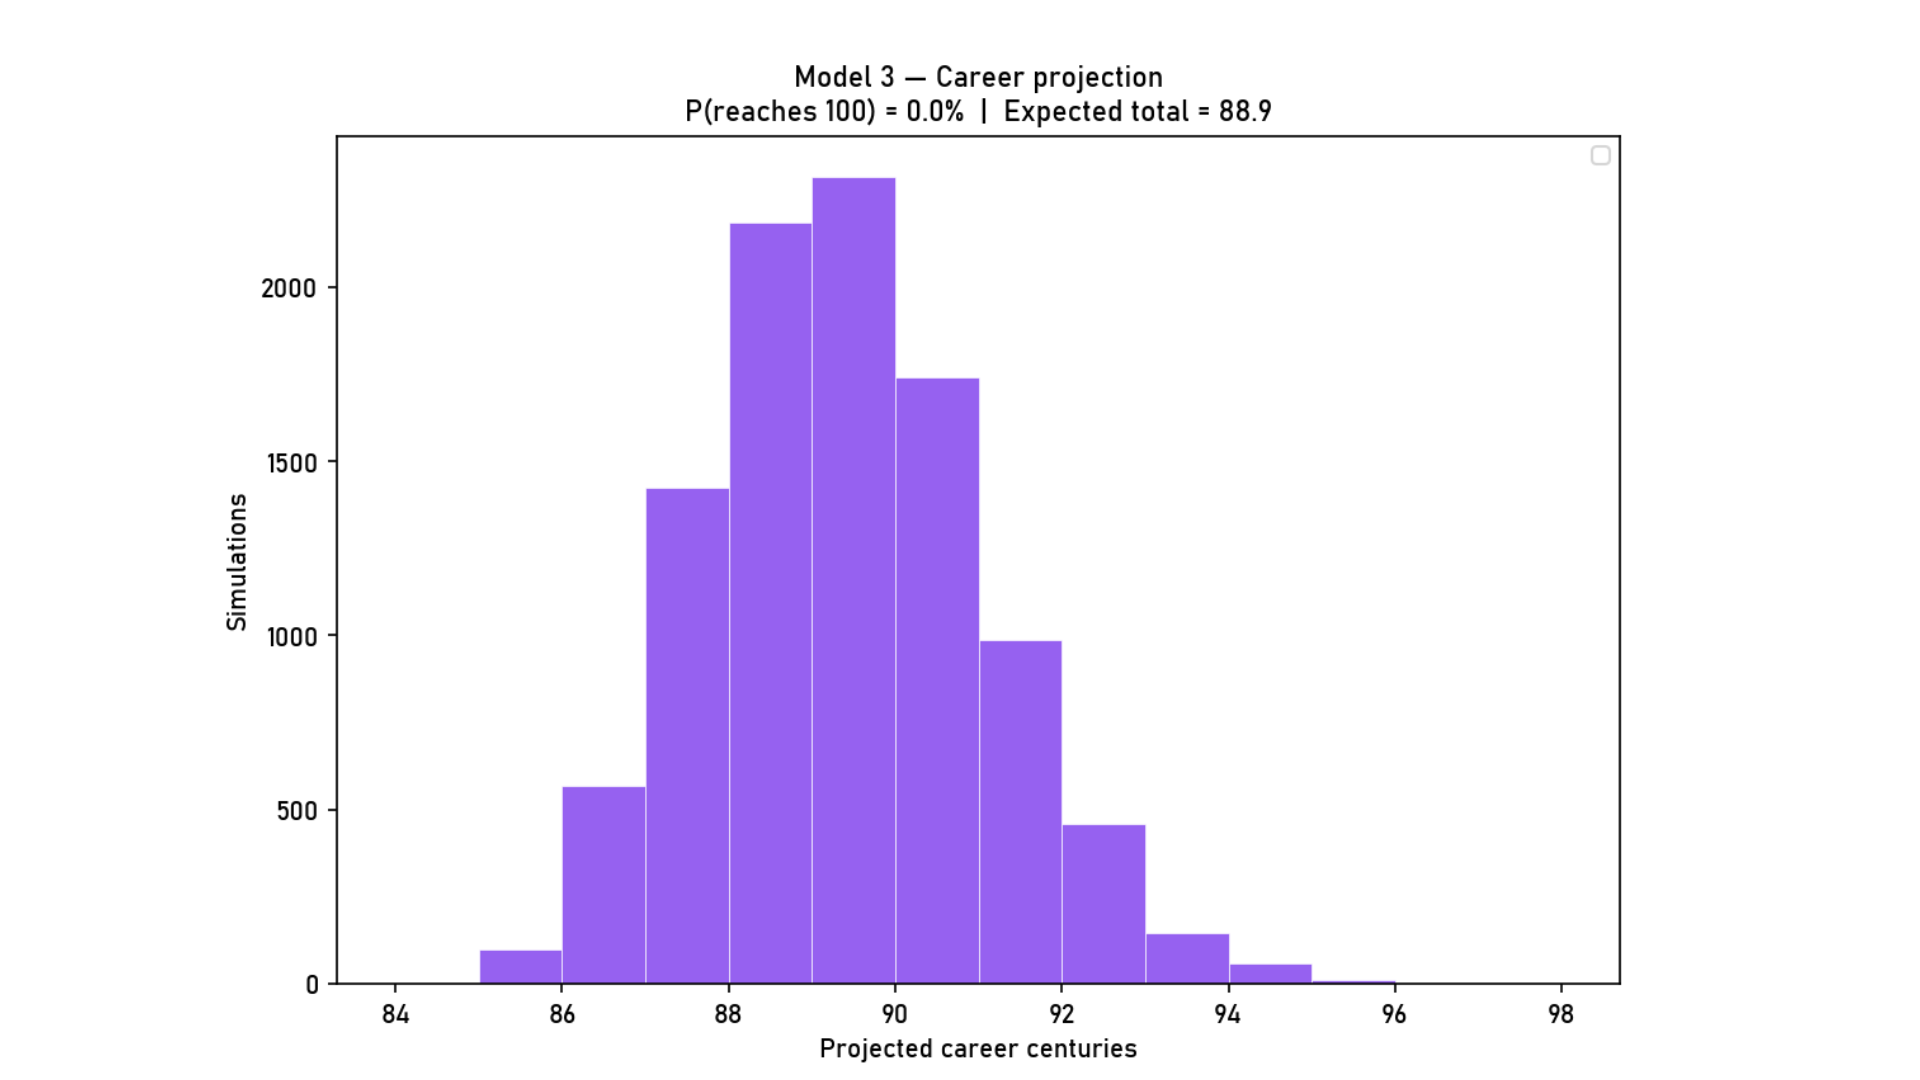
Model 3’s “Career” simulation for Kohli (which assumes he retires after these 17 games) predicts the batter to have a 0% chance of reaching 100 100s within his remaining games - not surprising at all, given he would need to convert 15 of up to 17 innings into tons.
However, this doesn’t truly mean Kohli has no chance of reaching the illustrious 100 international 100s. Beyond the fact that these are just predictions made by my own models, there are likely more ODI fixtures yet to be announced; Asia Cups, more bilateral series, and of course, the monumental 2027 Cricket World Cup in South Africa, which Virat Kohli will be eyeing to lift.
His fans, and fans of cricket worldwide would certainly hope these 17 games are the last we see of Kohli in international cricket, especially after all he has given to the game.
Until he decides to hang up the gloves, though, the looming century of centuries will be on everyone’s mind.
Model Architecture
This section documents the three probability models developed to estimate the likelihood of Kohli scoring a century in each upcoming ODI fixture. The models are built on ball-by-ball data ODI data from Cricsheet. Each model builds upon the previous, introducing additional contextual signals and refining the statistical approach. The models do not predict the exact runs Kohli will score in any given innings, but rather estimate the conditional probability of a century given the match context. These per-match probabilities then feed a Monte Carlo simulation that produces distributional estimates of his career century total.
The Case Against Point Prediction
The original project architecture called for two XGBoost regression models, one predicting runs scored and one predicting balls faced, with centuries counted by checking whether predicted runs ≥ 100. This approach was abandoned after persistent failure in validation.
The core statistical problem is that cricket batting scores are extraordinarily high-variance. A batsman as prodigious as Kohli may be averaging 58.7, but can still score a golden duck in his next innings. The coefficient of variation for Kohli’s ODI scores exceeds 1.0, meaning the standard deviation is larger than the mean. With a training set of approximately 240 innings and only 43 centuries (the remainder of his innings were used for testing), no classifier has sufficient signal to reliably identify the feature conditions that precede a century versus a failure.
The empirical evidence was unambiguous: across multiple XGBoost configurations (standard squared-error regression, log-transformed targets, Tweedie distribution objectives, and direct binary classification), every model converged to predicting approximately 50 runs for every innings, regardless of context. The validation MAE of 38.5 runs barely improved on a naive baseline of 38.7 runs that simply predicted the training mean for every match. Century detection on the validation set was effectively 0% across all model variants.
This is not a failure specific to this project. Published academic research on cricket batting prediction, including Bailey & Clarke (2006) and Kampakis & Thomas (2015), consistently reports that contextual models explain only 10–20% of variance in individual innings scores. The signal exists but is dominated by noise at the individual innings level. The solution was to reframe the problem. Rather than predicting individual innings outcomes, the models estimate conditional century probability from historical frequency data within contextual strata, combined via log-odds multiplication. A Monte Carlo simulation then propagates these per-match probabilities across the full remaining fixture list, producing a distribution of career century totals. This is both statistically sounder and more practically useful for content.
Feature Engineering
Seventeen features were engineered from the raw ball-by-ball data from Cricsheet, collapsed to one row per Kohli innings. All features use a shift(1) before any rolling computation to prevent data leakage — ensuring that the feature for match N uses only data from matches 1 through N-1.
Recent Form Features
-
ewma_runs_last10 — Exponentially weighted moving average of runs scored over the last 10 innings, using span=10 so more recent innings carry more weight. Computed as runs ÷ dismissals to match the cricket average definition, not runs ÷ innings.
-
avg_last5 / avg_last10 / avg_last20 — Rolling cricket average over a strict 5/10/20-innings window respectively. Uses the standard runs ÷ dismissals formula, with a fallback to total runs when the player has not been dismissed in the window (the standard cricket convention for not-out sequences).
-
rolling_sr_last10 — Pooled strike rate over the last 10 innings, computed as sum(runs) ÷ sum(balls_faced) × 100 rather than the mean of per-innings strike rates, which weights long innings appropriately.
-
not_out_rate_last20 — Fraction of the last 20 innings in which Kohli was not dismissed.
-
innings_since_century — Innings elapsed since his most recent century. Set to 0 in the innings immediately following a century; increments by 1 thereafter. Used as a drought signal.
Opposition and Venue Features
-
career_avg_vs_opp — Kohli’s all-time ODI cricket average against this specific opponent, computed as an expanding (career-to-date) statistic with shift(1). Recent performances are more heavily weighted.
-
avg_vs_opp_home_away — The same average split further by venue type (home/away/neutral). Where fewer than five prior innings exist in the combination, falls back to the broader opposition average.
-
venue_type — Encoded as home=2 / neutral=1 / away=0.
-
career_avg_at_venue — Kohli’s expanding average at the specific ground. Falls back to his venue_type average, then his overall career average, when insufficient innings exist at that ground.
-
venue_run_index — The all-batter cricket average at the venue across all ODI matches in the dataset. Serves as a pitch difficulty proxy: high values indicate flat, high-scoring grounds; low values indicate seaming or spin-friendly conditions.
Match Context Features
-
is_chase — One-hot encoded, (0: batting first, 1: batting second). Kohli’s ODI century rate when chasing is measurably higher than when batting first.
-
target_runs — The second-innings chase target. Structurally absent for first-innings matches. Caps the realistic ceiling on runs scored when chasing a small total.
-
required_run_rate — Runs per over required from the moment Kohli arrived at the crease. High required rates force a different tempo; low ones allow innings-building.
-
score_at_arrival / wickets_at_arrival — Team score and wickets fallen when Kohli came to bat. A healthy platform invites different playing conditions from a collapse.
-
is_tournament — Binary flag for ICC events (World Cup, Champions Trophy, Asia Cup). Kohli historically elevates his performance in major tournaments.
-
age_at_match — Decimal age at match date, included as a career-trajectory proxy for modelling natural performance decline.
Model 1: Bayesian Historical Rate Model
Model 1 Design Philosophy
Model 1 establishes a principled baseline by computing Kohli’s historical century probability against each opponent and in each venue type, applying Bayesian shrinkage to handle small sample sizes, and multiplying by a simple recent-form multiplier. It makes no attempt to incorporate venue-specific ground history beyond the broad home/away/neutral split.
Model 1 Probability Computation
For each upcoming fixture, the probability is computed as:
Step 1: Look up Kohli’s historical century rate against the specific opponent, broken down by venue type (home/away/neutral). If at least 5 prior innings exist in this combination, use the combined rate; otherwise fall back to the broader opposition rate.
Step 2: Apply Bayesian shrinkage toward the career base rate using k=10, meaning a group needs approximately 10 innings of history before its observed rate is trusted at 50% weight over the career mean.
Step 3: Multiply by a form multiplier computed as the ratio of his century rate in the last 20 innings to his career century rate.
Step 4: Apply a hard probability floor of 5% and ceiling of 55%.
Model 1 Limitations
Model 1 uses only the broad venue type (home/away/neutral) rather than ground-specific history. It defines ‘recent form’ as a century rate rather than a run-scoring level, meaning a player going through a high-scoring purple patch with no centuries would be penalised despite being demonstrably in form. The form multiplier also makes no distinction between a recently completed century (suggesting momentum) and a prolonged drought.
Model 2: Enhanced Form Model
Model 2 Design Philosophy
Model 2 replaces the century-rate-based form signal with a richer composite derived from actual run-scoring levels, adds not-out rate as a secondary form indicator, and introduces a drought adjustment based on innings since last century. The venue adjustment retains the all-time run index rather than ground-specific Kohli history, which is addressed in Model 3.
Model 2: New and Modified Components
The following components distinguish Model 2 from Model 1:
-
Combined form multiplier (60/40 EWMA/Avg10) — The form signal is now derived from batting average levels rather than century frequency. The combined form score is: Form = 0.60 × ewma_runs_last10 + 0.40 × avg_last10. This is divided by Kohli’s career average to produce a multiplier. If he is currently averaging 75 on a career average of 59, the multiplier is 1.27×, boosting all match probabilities proportionately.
-
Not-out rate adjustment (±15% maximum) — His recent not-out rate is compared to his career not-out rate. If he is completing innings more frequently than his career norm, probabilities are nudged upward by up to 15%; the converse applies for a higher-than-usual dismissal rate.
-
Drought adjustment (maximum +10%) — For each innings elapsed since his last century, a 0.5% boost is applied, capped at +10% after 20 or more innings. This reflects both the statistical expectation of regression to the mean and the psychological dimension of milestone awareness.
-
Form multiplier cap raised to 2.0× — The 2.0× ceiling (from 1.0× in Model 1) allows strong current form to more meaningfully elevate predictions.
Comparison vs. Model 1
Counterintuitively, every probability in Model 2 is lower than in Model 1 despite the form multiplier being above 1.0 (Kohli’s combined form score of 74.8 versus a career average of 59.4 gives a multiplier of approximately 1.26×). The reason is that the not-out rate adjustment is currently negative: his recent not-out rate is below his career norm, applying a penalty of approximately 8–10% that more than offsets the form boost. The drought adjustment contributes 0% because his most recent innings was a century (innings_since_century = 0).
Model 3: Match Factor Venue Model
Model 3 Design Philosophy
Model 3 addresses the two most significant limitations of Model 2: the form weighting and the venue signal. The form multiplier is reweighted toward the EWMA (70/30 instead of 60/40) to increase sensitivity to the most recent innings, and the venue adjustment is replaced with a Match Factor computation that compares Kohli’s performance at each specific ground only against contemporaries who played in the same matches.
Model 3 Match Factor Venue Adjustment
This is the most technically novel component of Model 3. For each ground in the upcoming fixture list, the model computes Kohli’s Match Factor Average at that venue as follows:
-
Identify all ODI matches played at that ground in the Cricsheet dataset where Kohli appeared in the playing XI.
-
For each of those matches, compute batting statistics for all top-6 batters in both teams.
-
Aggregate across all identified matches to produce a group benchmark: total runs scored by all top-6 batters ÷ total dismissals of all top-6 batters. This is runs-weighted, not player-weighted, ensuring it is not distorted by batters with only one or two innings.
-
Compute Kohli’s average at that venue using the same innings subset.
-
Match Factor Average = Kohli average ÷ Group average. Values above 1.0 mean he outperforms his contemporaries at that ground; values below 1.0 mean he underperforms.
-
Apply Bayesian shrinkage toward 1.0 (no adjustment) using k=5, and cap the shrunk edge at [0.65, 1.55] to prevent extreme adjustments from sparse samples.
This approach differs critically from the venue_run_index used in Models 1 and 2. The run index averages across all batters of all eras at that ground, including players from different decades, different formats, and different pitch conditions. The Match Factor approach uses only the exact contemporaries who played in the same matches as Kohli, on the same pitches, under the same conditions. For high-history grounds like Wankhede or Lord’s where Kohli has multiple innings, this provides a genuinely like-for-like performance comparison.
Model 3 Form Weighting Changes
a) 70/30 EWMA/Avg10 blend — The EWMA receives increased weight (from 60% to 70%) because it is more responsive to the most recent few innings. If Kohli has scored heavily in the last 3 games, the 70% EWMA weight amplifies this signal more than the 60% version would.
b) Form multiplier cap raised from 2.0× to 2.5× — Allows exceptional recent form to express itself more fully in the predictions, without the hard 2.0× ceiling that would clip an outstanding scoring run.
Model Comparison
(content coming)
Feature Comparison
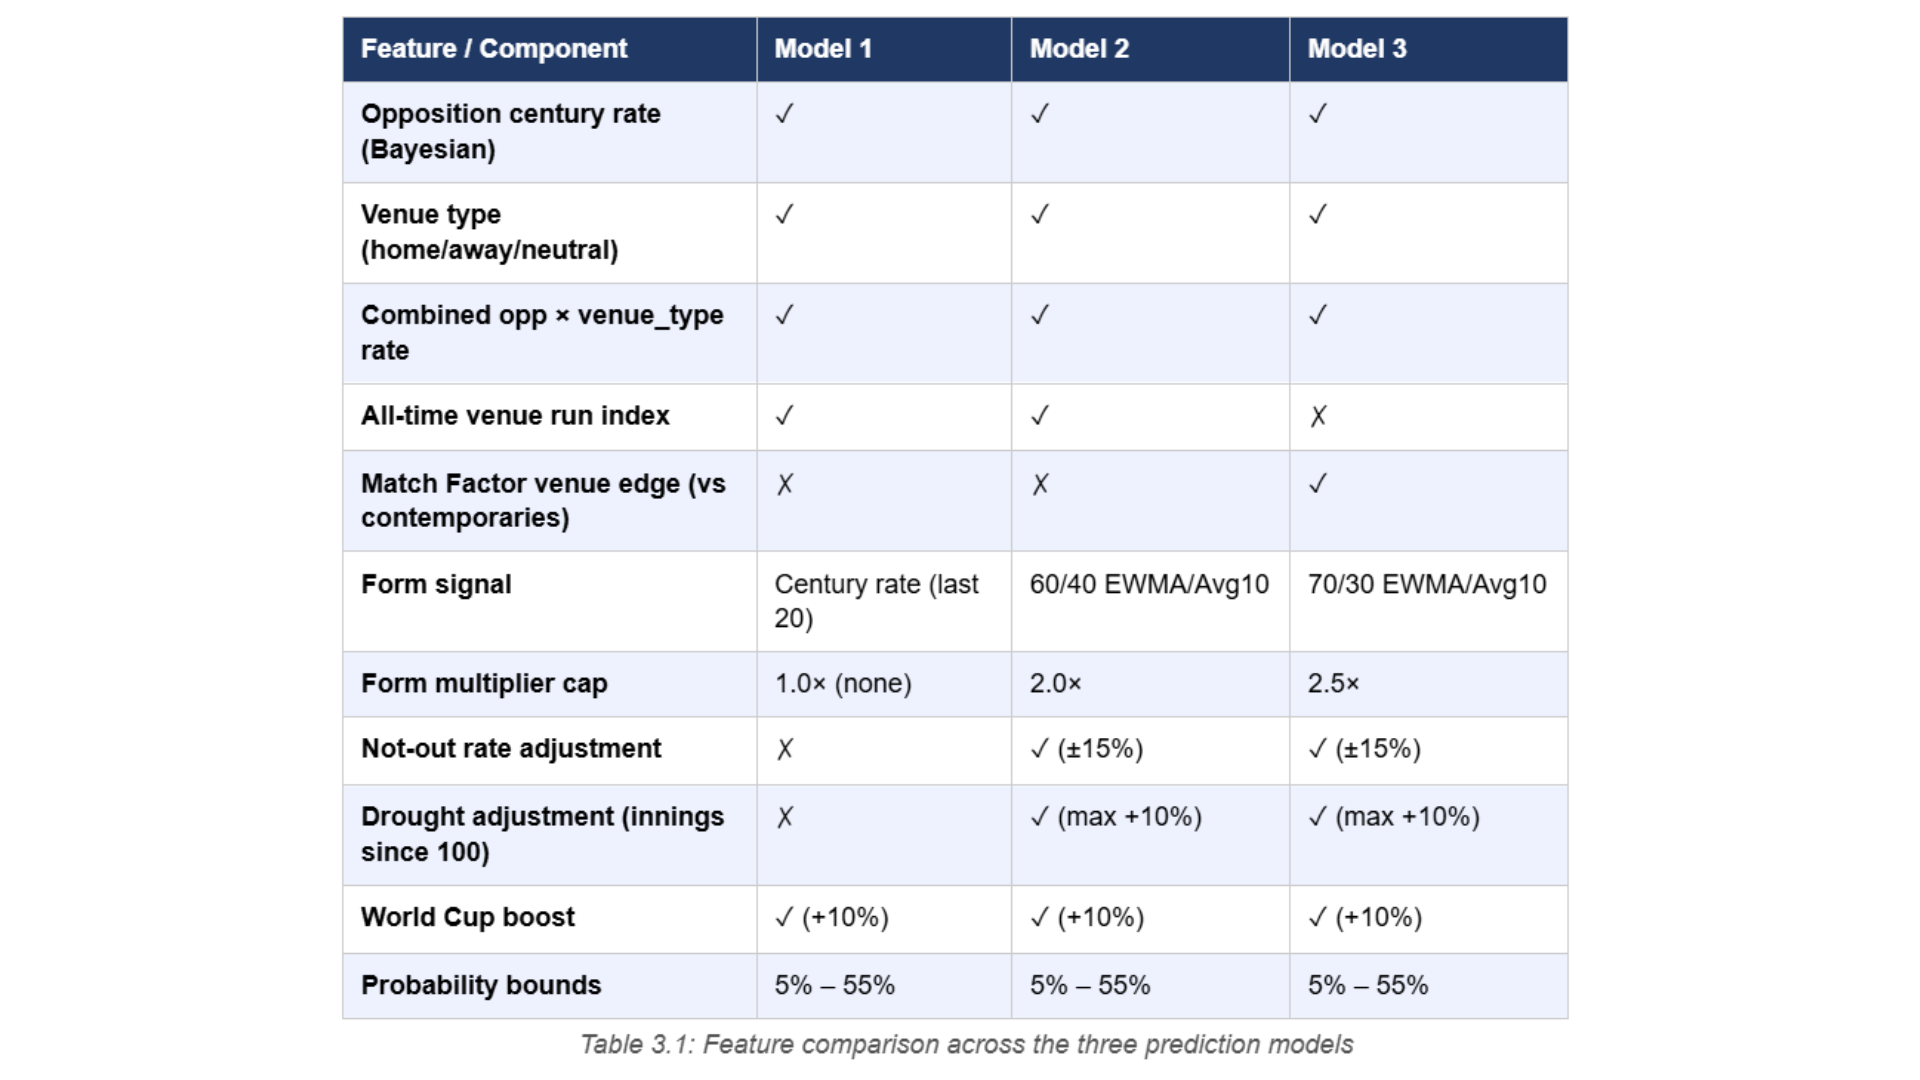
Table 3.1 Compares all features among the three models
Full Game-by-Game Predictions
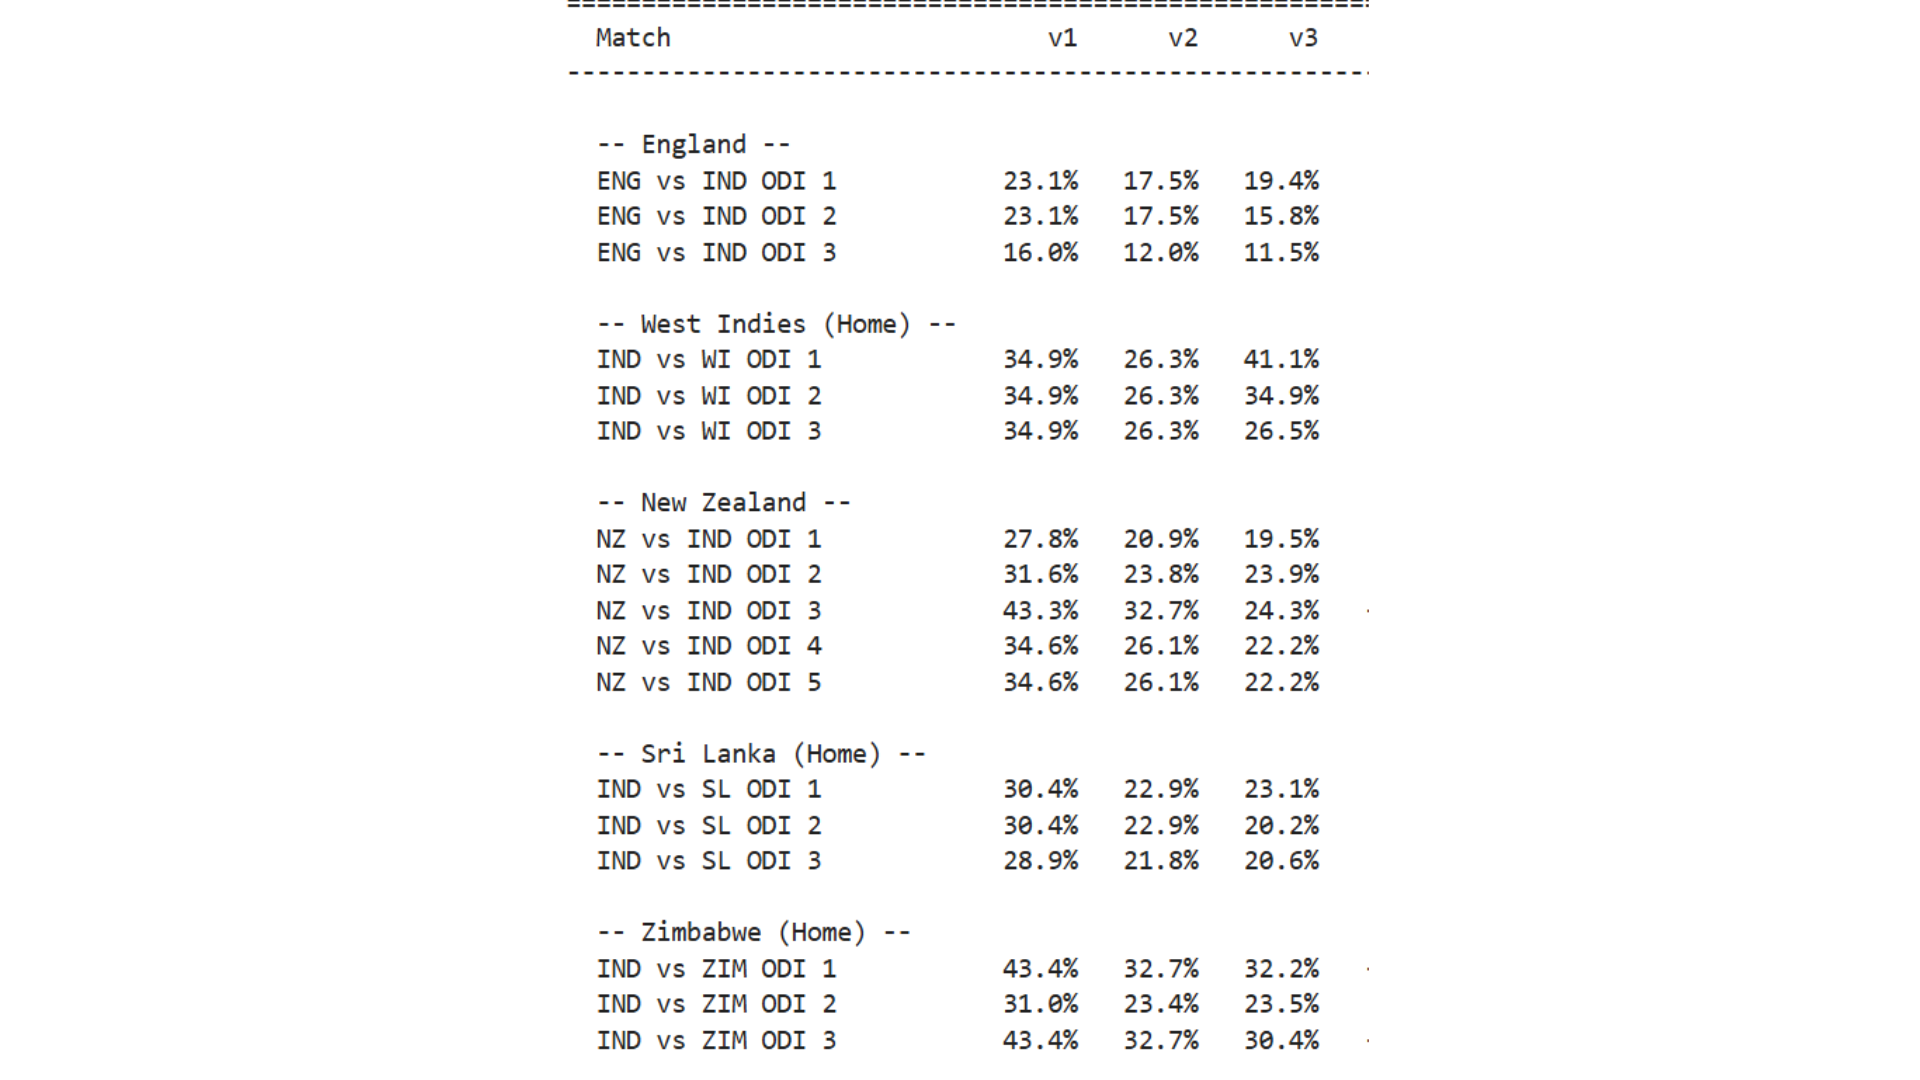
Below are all the game-by-game probabilities of Kohli scoring a century, predicted by the three models for each of the upcoming 17 fixtures.
Simulation Architecture
All three models use an identical Monte Carlo simulation framework. Once per-match probabilities are computed, 10,000 career simulations are executed by sampling Bernoulli random variables for each fixture:
-
Availability sampling: Each match is independently subject to a 5% unavailability probability, representing injury, rest, or other selection factors. If unavailable, the match contributes no century regardless of the computed probability.
-
Century sampling: For each available match, a Bernoulli trial is drawn with probability p from the relevant model. If the draw falls below p, a century is recorded for that simulation.
-
Accumulation: Simulated centuries are summed across all fixtures and added to Kohli’s actual current century total of 85. If the total reaches or exceeds 100, that simulation is marked as a ‘record-equalling’ outcome.
-
Distribution: After 10,000 simulations, the distribution of total career centuries is computed, yielding P(reaches 100), expected career total, median total, and percentile bands. The simulation is also decomposed by series, computing P(0 centuries), P(1 century), P(2 centuries), and P(3 centuries), etc. for each individual series. This allows identification of which series are most critical to Kohli’s path toward the record. The New Zealand five-match series and the Zimbabwe home series emerge as the highest-probability opportunities across all three models due to the combination of a favourable opponent history and strong venue conditions, as well as a longer series in the case of the New Zealand tour.
Simulation Results (Model 3)
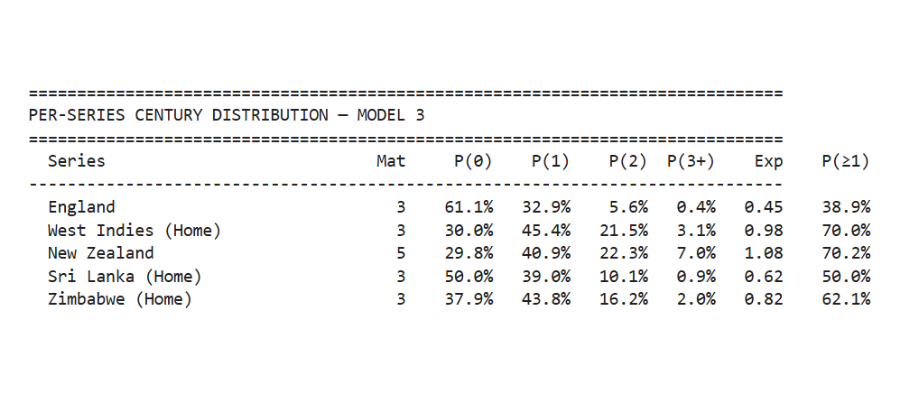
Here are the simulation results for Model 3, with the probability distribution of Virat Kohli scoring centuries in the 5 upcoming ODI series.
Assessment of Model Limitations
Several important caveats apply to all three models:
-
Static form snapshot: All form features are computed once, at the time the simulation is run. They do not update between matches in the simulation. The model cannot capture the scenario where Kohli scores three centuries in the England series, which would dramatically change his form heading into the next series.
-
No injury or retirement modelling: The 5% per-match availability penalty is a flat approximation. Correlated unavailability (an extended injury that removes an entire series) is not modelled. A retirement before the anticipated series would dramatically reduce projected totals in ways the simulation cannot anticipate.
-
Static opposition bowling: Historical matchup rates against England or New Zealand are computed from past series. The bowling attacks Kohli faces in 2025 are different from those in his career data; players retire and emerge. The model is limited by the available matchup data.
-
Unannounced fixture uncertainty: The fixture list is restricted to confirmed series. Additional ODI series announced after the simulation was built are not included, meaning the model likely underestimates the total innings available to Kohli through to 2027.
Reflections on Model Design
The three-model progression reflects the standard applied machine learning workflow:
Baseline → Feature Enrichment → Improved Signal Quality.
Model 1 establishes that historical matchup rates, correctly Bayesian-shrunk, provide a defensible prior. Model 2 demonstrates that run-level form signals carry more information than century-frequency signals alone, at the cost of requiring careful calibration of the interaction between not-out rates and form multipliers. Model 3 shows that venue adjustments based on era-matched contemporaries produce more contextually valid estimates than all-time ground averages.
The decision to use conditional probability estimation rather than direct regression is the most consequential design choice in the entire project. It accepts that individual innings outcomes cannot be predicted with meaningful accuracy and instead targets the quantity that can be estimated well from historical data: the rate at which Kohli scores centuries across different contextual conditions. The Monte Carlo framework then converts these rates into a career projection with appropriate uncertainty quantification, which is ultimately the question I set out to answer.
Full code and data pipeline available on request.